Revealing the culprit
At long last, we arrive at this investigation’s final stop: Another PhD thesis of the same department. It resembles Fis’ in many ways—similar inconsistencies, problematic data, self-contradictory claims… but with one decisive difference: It actually shows data, and thus enables scrutiny.

Allow me to get something out the way before we dive into the data: I never met Köhler, and I regret pulling them into this. Their research was conducted years before I ever set foot in the department, and while there is much to say about it, their thesis is significantly more valuable than Fis’. It is more comprehensive, clearer, cleaner, and I only review it in part. The full document contains a lot more information, which I ignore because it bears no relevance to the topic at hand. The parts I do discuss, however, are absolutely crucial, as they document the development of the investigation method later adopted by Fis. It is consequently intriguing to see many of the same flaws in Köhler’s data.
Criticism re: force spectroscopy
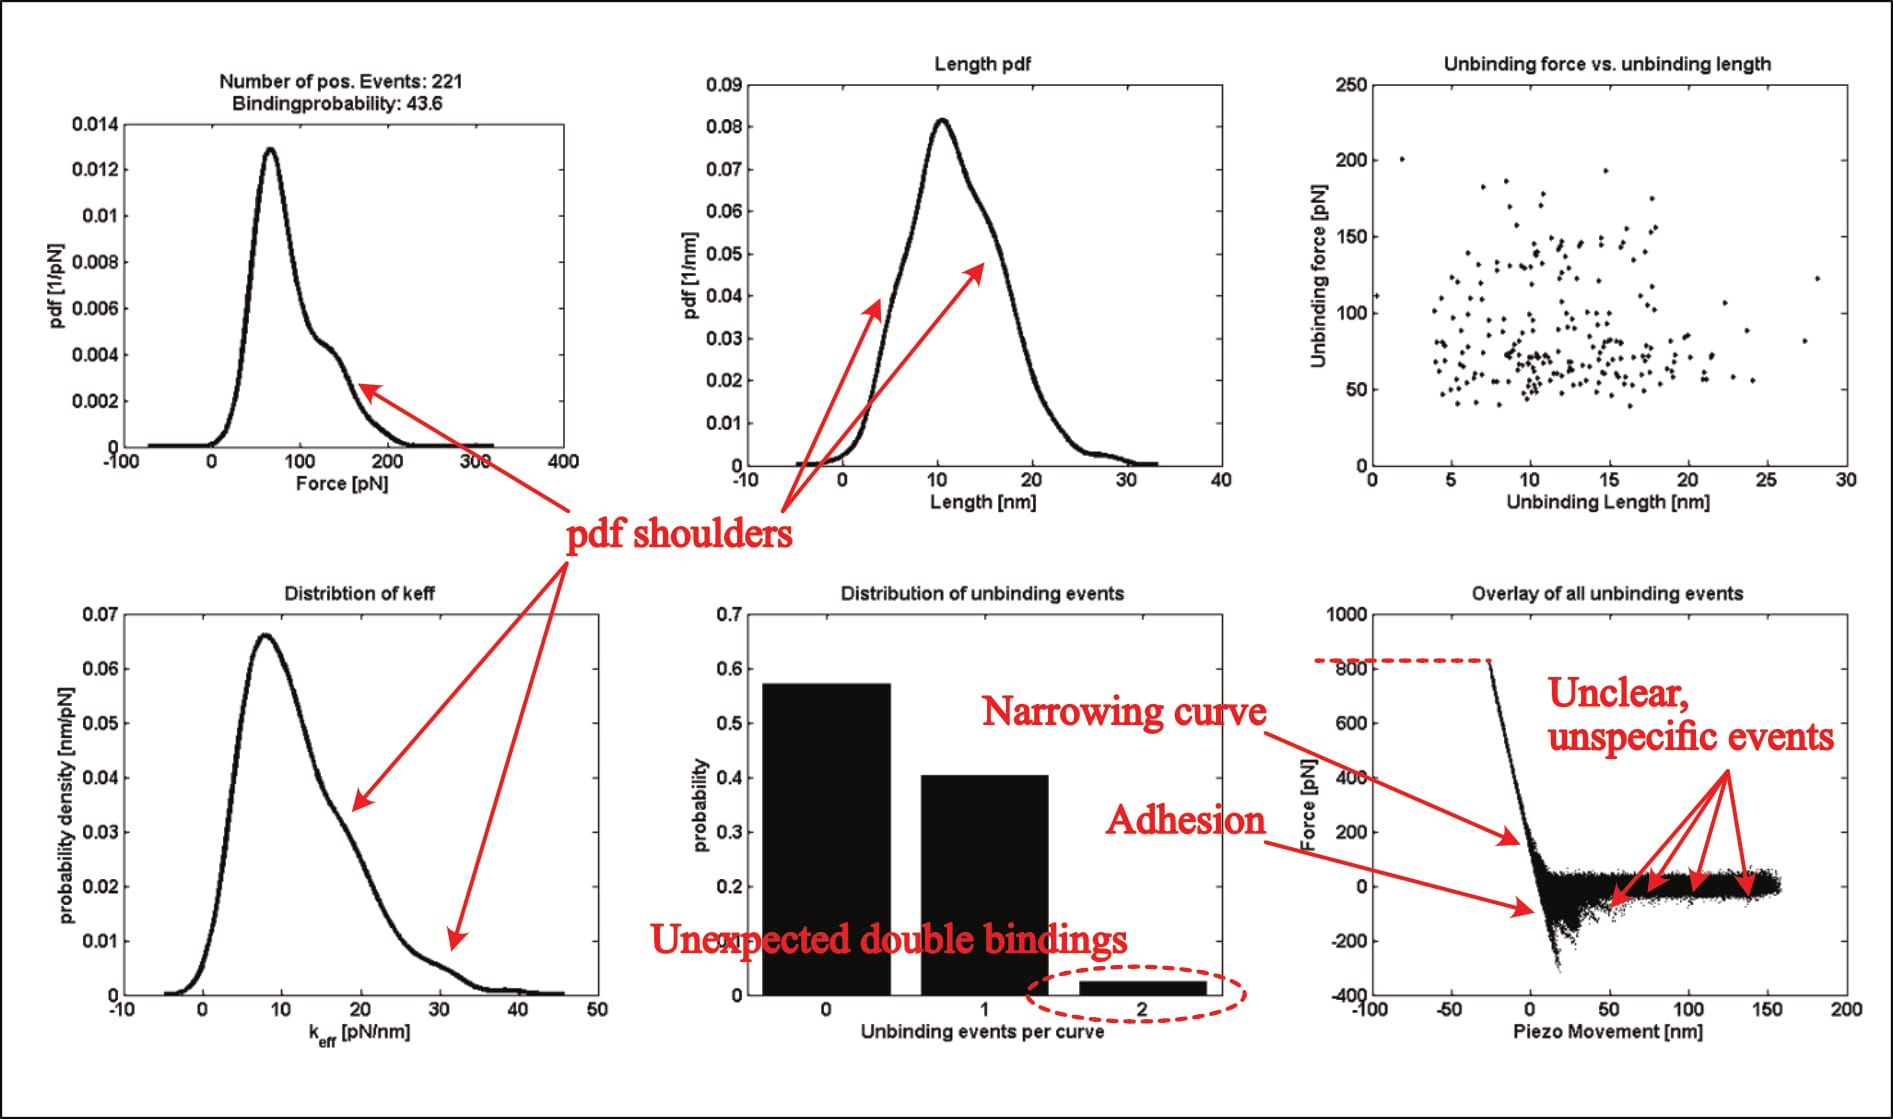
For example, their only shown kspec plot—the statistical analysis results of individual force measurements—shows eerily similar issues (Köhler, 2016, p. 24):
- excessive indentation force of ~800 pN (compared to ~900 pN in Fis, 2018, p. 40),
- very obvious unspecific adhesion, which is even verified and described in other parts of the thesis (see discussion below),
- unbinding events at distances far beyond the linker length “between 6 and 8 nm” (Köhler, 2016, p. 20), …
- …only some of which were identified as interaction, with no selection-rationale described,
- a thickening of the curve overlay in the contact area (almost vertical section of the curve), indicative of sudden cantilever movement—again verified and described in other parts of the thesis (see discussion below),
- shoulders in the probability distributions (suggesting multiple interaction regimes), and
- significant noise indicative of cantilever oscillation/vibration where none should be (in the horizontal parts of the curve overlay).
All issues that also appear in Fis’ thesis—including the fact that the figure's underlying experimental condition is unmentioned.
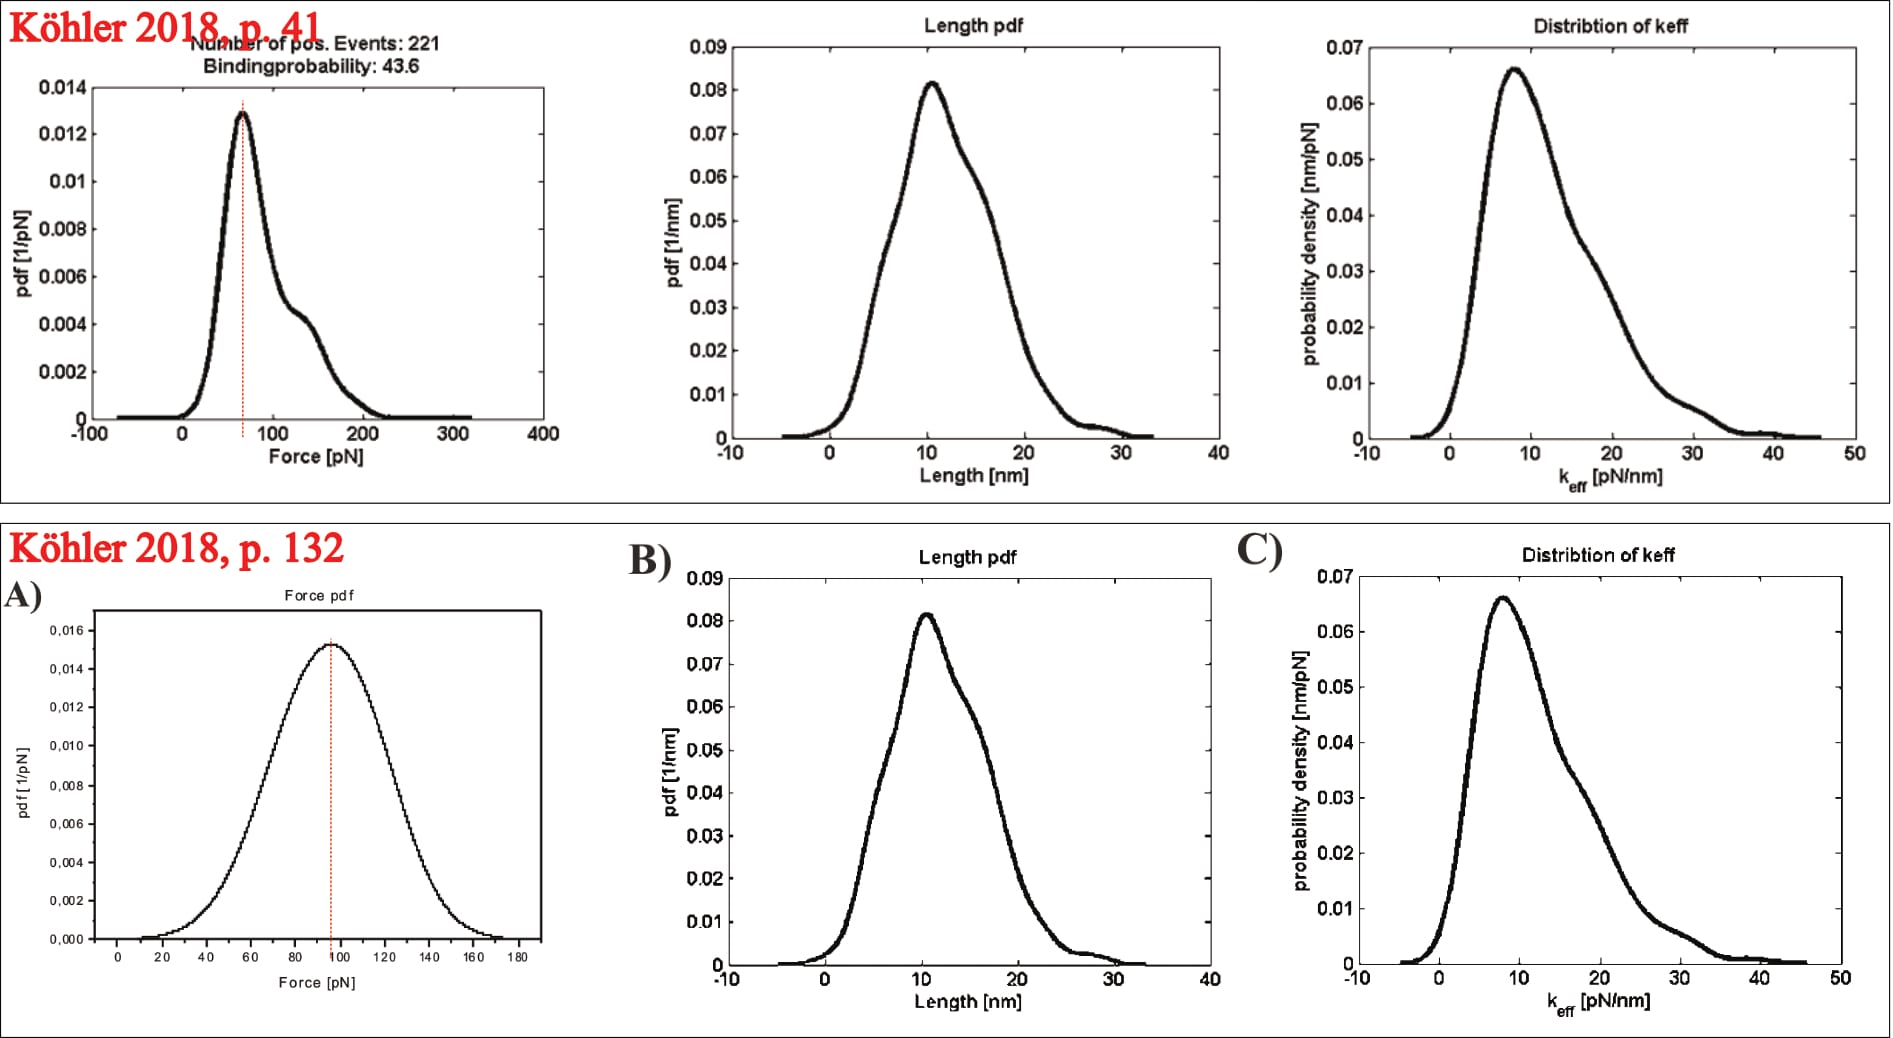
However, this time, the exemplary plot can be identified: Two of its panels are later repeated, and their experimental condition described (as the UCP1-ATP interaction at a pulling velocity of 400 nm/s; Köhler, 2016, p. 132). Thus, it is indeed real data. Note that one of the plots (see below), diverges between the two figures. It is unclear what causes this change. It could theoretically stem from data trimming, though that seems unlikely (unless the department-internal program trims data points exclusively for one distribution, but not the others of the same data-set).
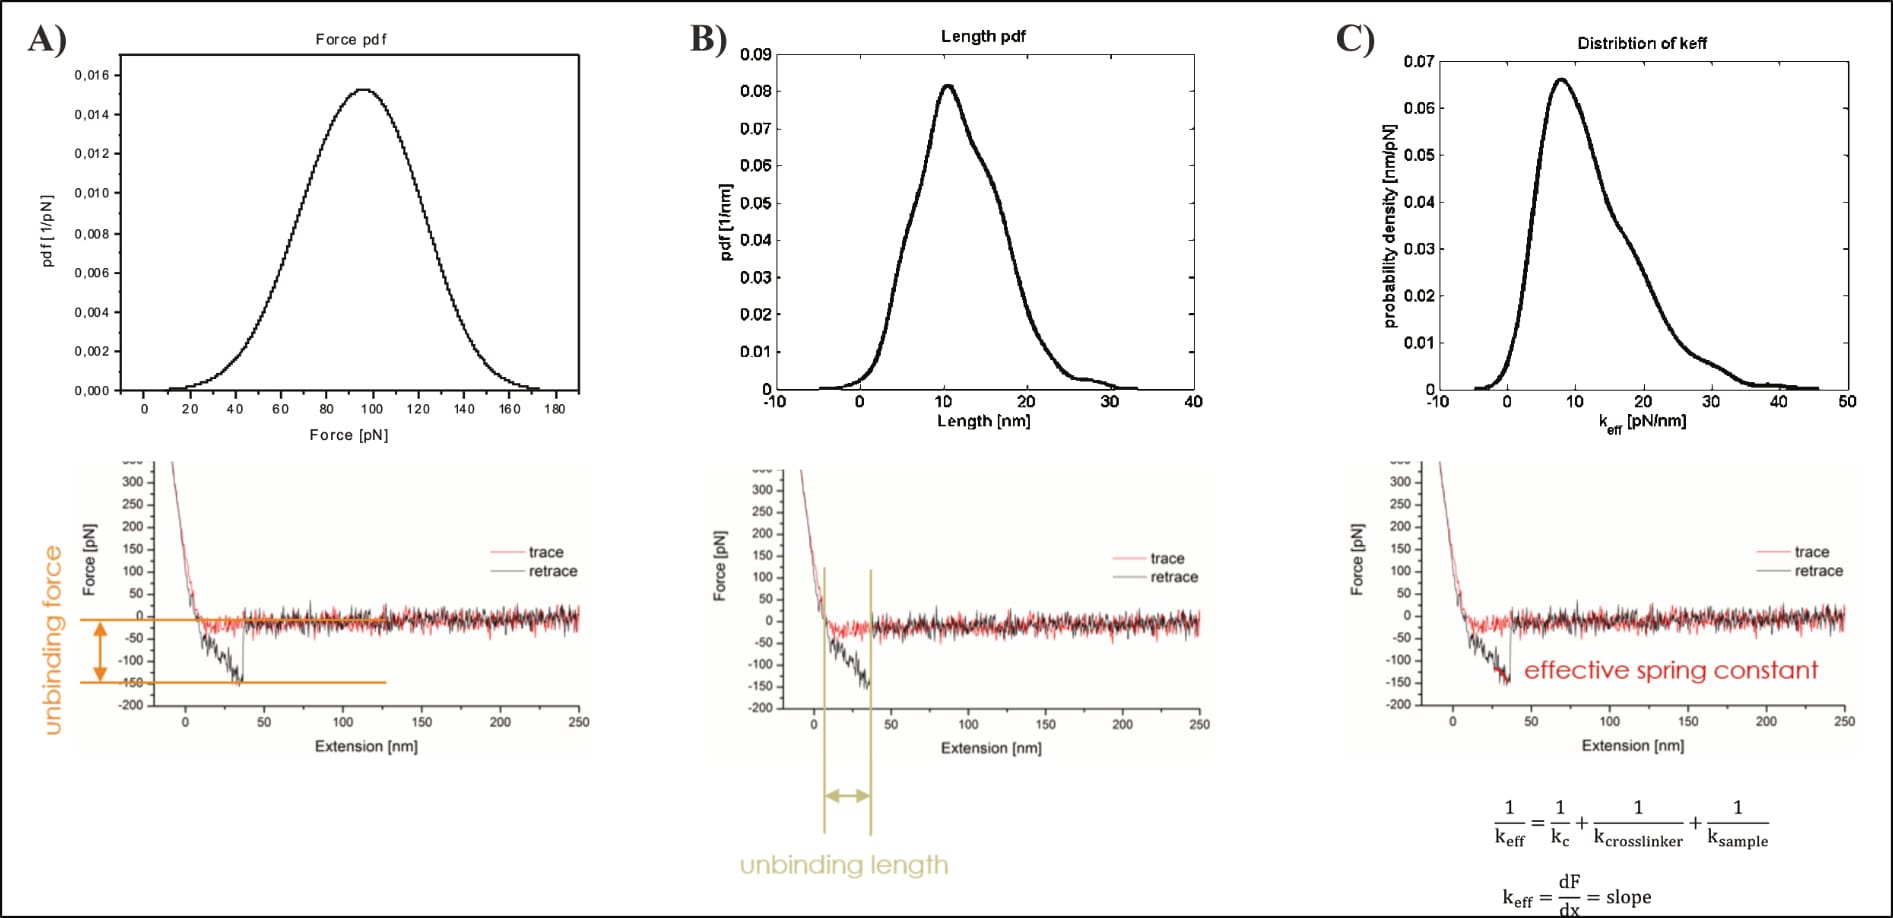
Köhler also presents three individual force distance cycles (FDCs) of the UCP1-ATP measurement to describe various observed signal shapes, one of which supposedly represents their targeted interaction—a level of data insight not possible for Fis. However, the individual curves raise immediately questions. First off, the maximum indentation force varies greatly, reaching 350, 500, and 1000 pN, respectively. As already discussed for Fis, this value “should always be kept at a minimum” to “prevent a too high number of forced unspecific interactions” (Diethör, 2022, pp. 34, 53) and “minimise adhesive or unspecific events” (Suh, 2022, p. 129). Köhler themself denote that “high shear forces might damage soft biological samples”. In short: it “should be kept as low as possible in order to prevent damages of the sample” (Fis, 2018, p. 18). Köhler does not mention this crucial consideration.
Of note: The here cited comparative theses (of Diethör and Suh) show decisively lower maximum indentation forces of about 60-80 pN. Diethör also deliberately excludes data after applying 400-500 pN (approximately half of what Köhler accepted without question!) due to the risk of introducing a confounding factor (Diethör, 2022, pp. 41-42, 47).
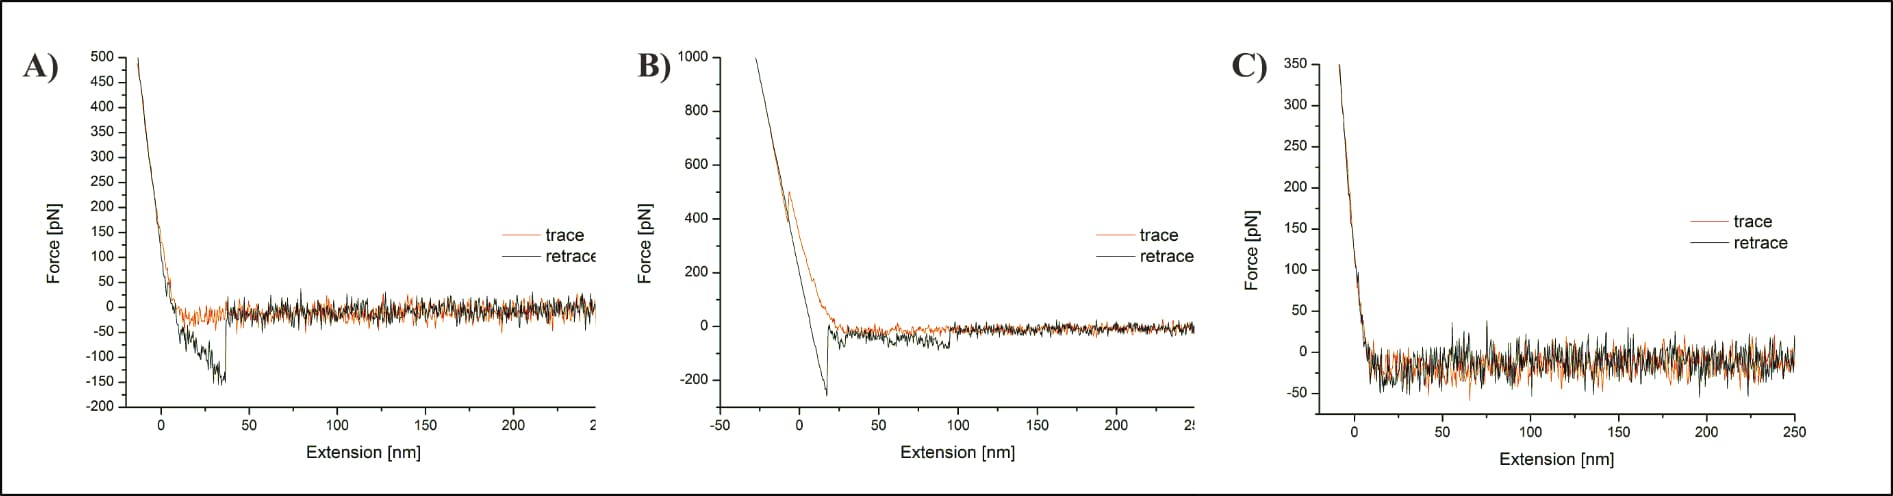
Additionally, Köhler’s representation of the unspecific interaction shows an unknown interaction far beyond the described adhesion, at approximately 100 nm distance. Not only is it entirely unclear what causes this (or might theoretically introduce it), but the issue isn’t even mentioned. To make matters worse, the same FDC also shows a distinct “penetration of the membrane with the AFM tip” (Köhler, 2016, p. 131). Köhler incomprehensibly claims that such membrane penetration is not possible for “specific measurements carried out on the protein”, but only on a “pure lipid membrane spot”, and that somehow this helps clarify appropriate measurements (Köhler, 2016, p. 131). However, this would require the surface to be entirely rigid, as well as the protein to have no issue withstanding the applied pressure, both of which seems entirely unlikely. Proteins need to be properly folded to perform their function, and the here applied force is approximately half of what would break a covalent bond. Nothing justifies the expectation that such pressure would not affect the protein (and no reasoning for this implicit expectation is provided). It is just as unreasonable for the surface to remain as rigid as necessary for the claim. Membranes are not fixed structures, and embedded proteins can (and do!) move within them. Not to mention how thermal drift—“a common technical issue during AFM measurements” (Köhler, 2016, p. 30)—may influence it all. Confusingly, Köhler then adds (in the very next sentence!) that this penetration “mostly occurred when the force applied to the sample was set too high”, directly verifying not only that the surface was frequently damaged, but also that the reason for it was indeed an excessive indentation force (Köhler, 2016, p. 131). Of note, with regard to Fis (2018): Köhler’s surface penetration of a lipid membrane occurred at an applied force of about 500 pN, roughly half of Fis’ maximum force. There is more to follow on this point, once we compare the two experimental setups.
There are also several suspicious aspects regarding Köhler’s representative FDC of the targeted interaction. Aside the excessive indentation force, the observed unbinding takes place at roughly 40 nm, far beyond the linker’s described length “between 6 and 8 nm” (Köhler, 2016, p. 20), and the measured unbinding force appears surprisingly large. Much larger, for example, than one of the strongest known non-covalent bonds that is often exploited by researchers because of that extraordinary strength: The streptavidin-biotin interaction, which Köhler and others of the same department investigated just briefly before—using a highly similar setup, and probably the very same instruments (Köhler et al., 2014; Note: That publication shows an unbinding event with a parabolic shape as expected, providing direct comparison of the same researcher. See also Fis’ data discussion for further force value discussion.).
However, the possibly most damning error only becomes apparent for Köhler’s depicted interaction selection. After data collection, all (of the thousands of) FDCs are individually reviewed, and the relevant unbinding events manually selected for further (statistical) analysis. It is consequently pivotal to select only real interactions, which is why the “characteristic non-linear force signal, arising from the stretching of the distensible PEG-crosslinker” is so important (Köhler, 2016, p. 20). In their own words, “the most crucial profit of stretchable crosslinker is the possibility to clearly distinguish between unspecific adhesion and specific binding events” (Köhler, 2016, p. 20; compare also pp. 12, 13, 31, or e.g. Fis, 2018, pp. 18, 19, 26). Yet, the shown interaction event does not at all show the expected parabolic shape, and the mathematical fit used for its further statistical analysis is utterly inappropriate. It does not include—as it should—the entire event from contact point (the moment at which the curve goes changes from vertical to horizontal) to unbinding (curve snapping back to horizontal baseline), but only the very last bit. Additionally, its shape does not reflect the underlying data curve, which could easily be just as appropriately fit by a linear model.
Consequently, all three relevant dimensions (force, distance, shape) suggest a problematic event that cannot be trusted to show an actual unbinding of the targeted interaction. All these discernible issues of the individual FDCs, however, perfectly corroborate the problems in the kspec plots (of both theses). The theses do not represent a serendipitous aggregation of many different issues, they document the progression of (obvious) false positives through data analysis.
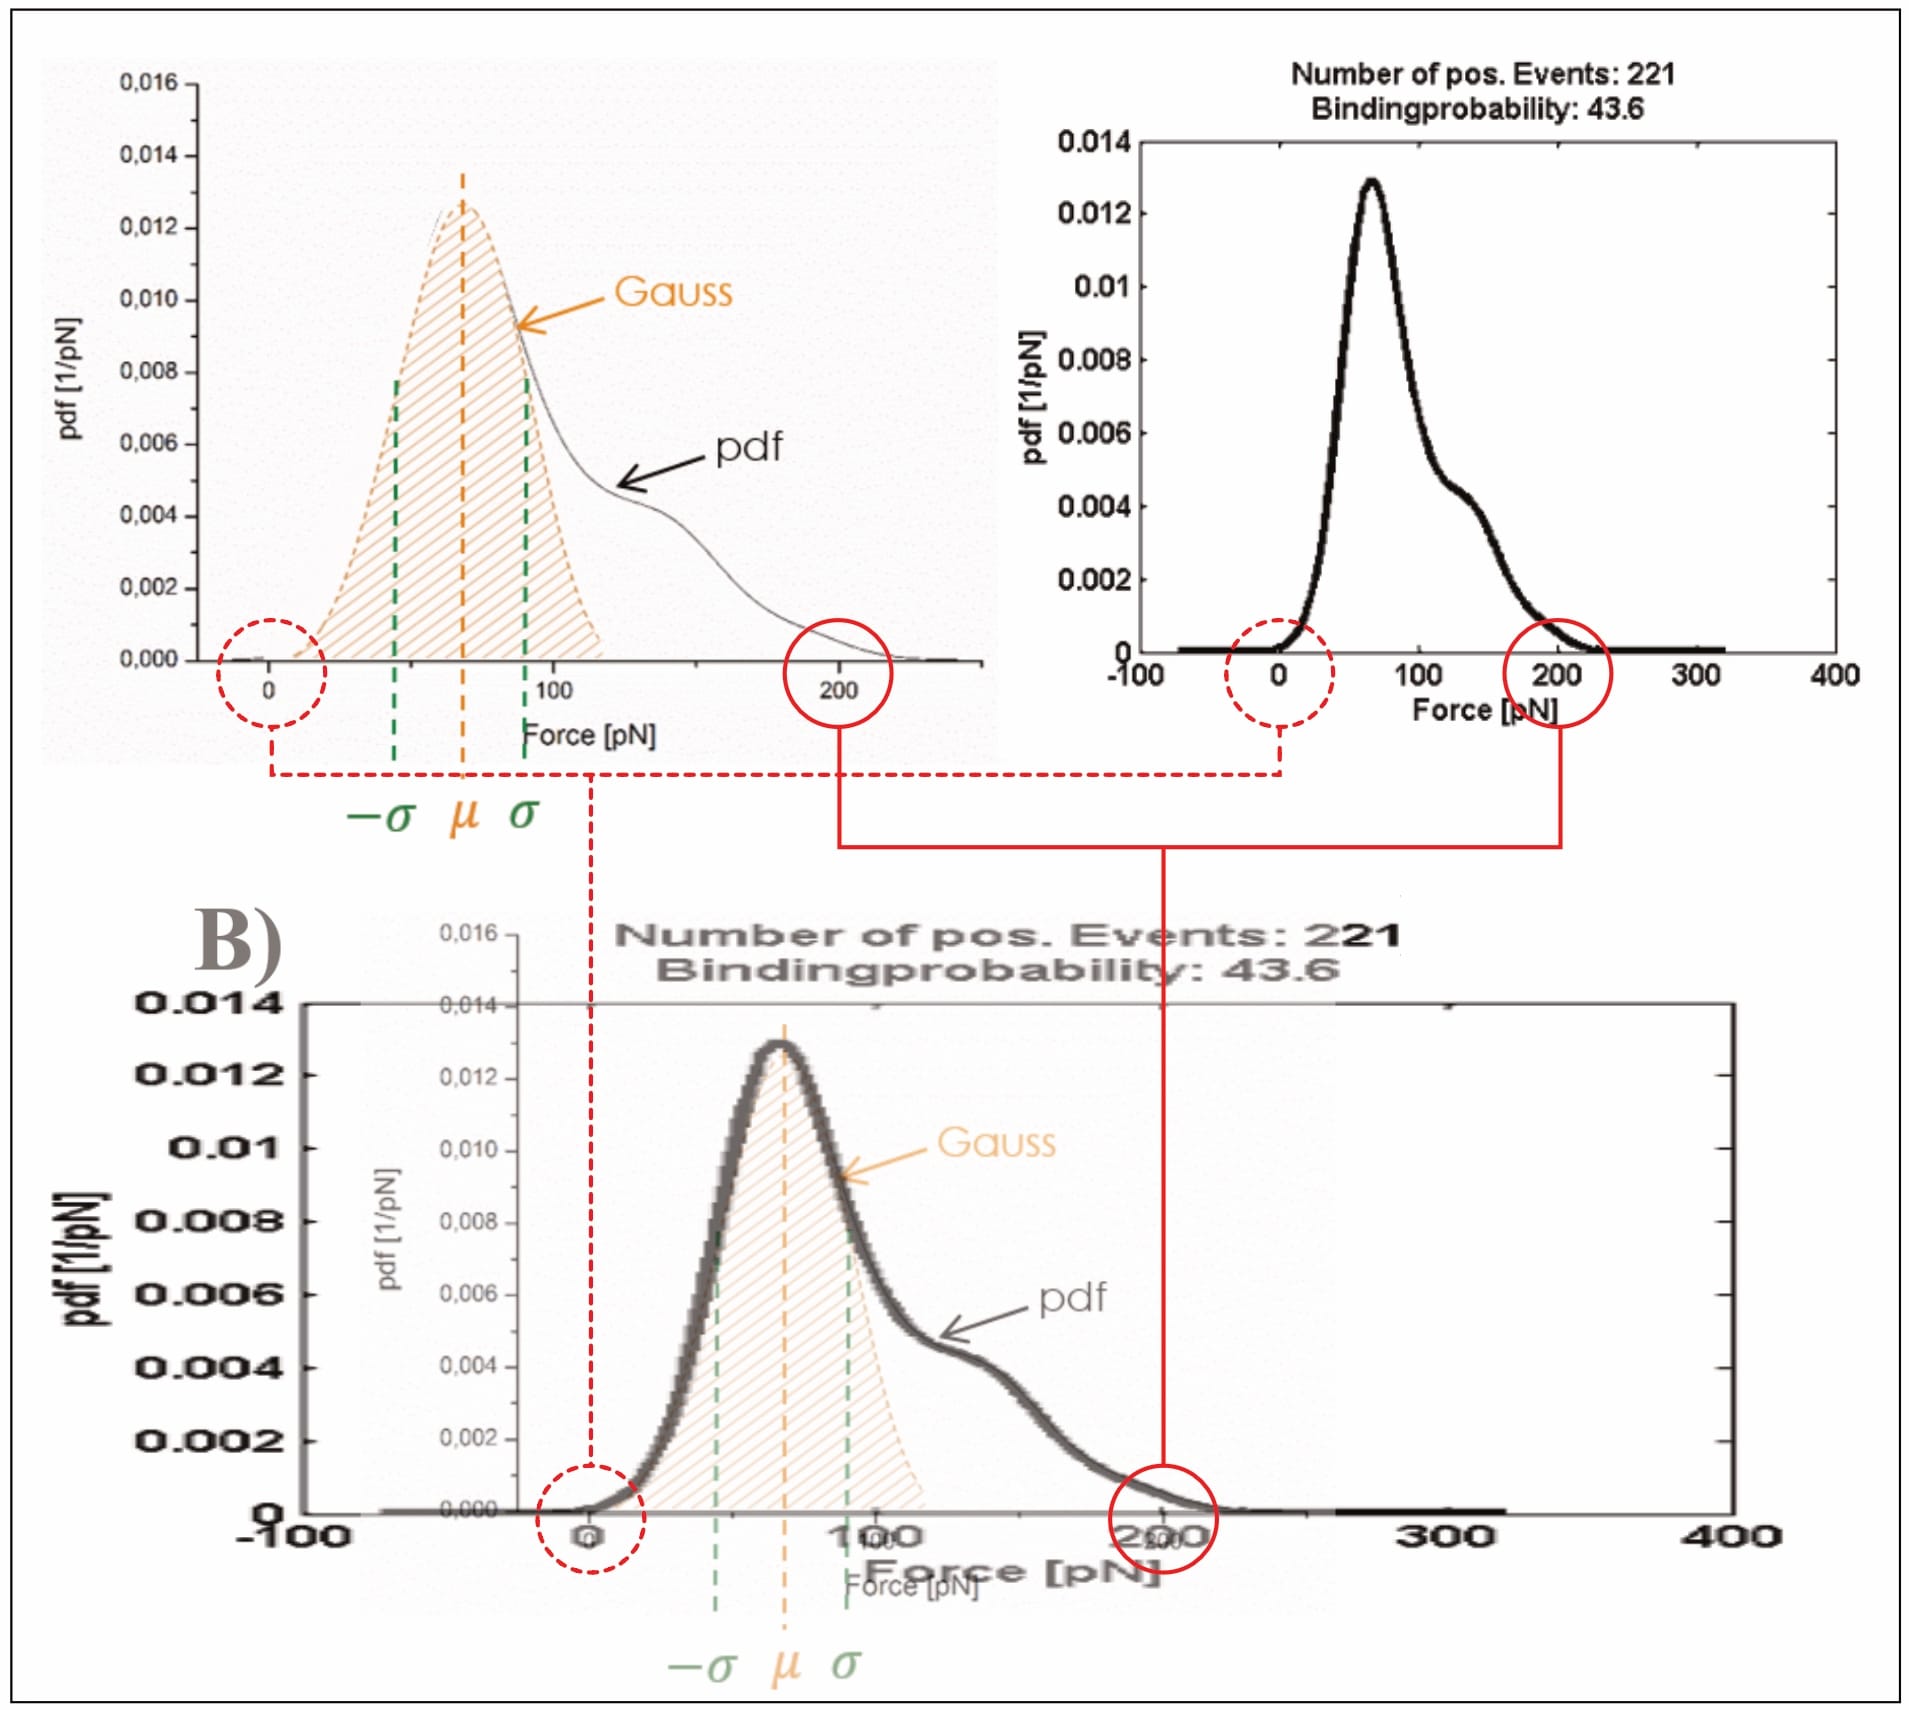
After this first-step statistical analysis, the data is trimmed to “the interval [µ±σ] (i.e., first main peak in the force PDF)”, in an effort “[t]o make the analysis more precise” (Köhler, 2016, p. 26). This narrowing of data aims to remove a “‘tailing’ in the data cloud in the loading rate dependence (LRD) plot”, which is also visible “as a ‘shoulder’ in the Gauss distribution for the most probable unbinding force” (Köhler, 2016, p. 26). However, Köhler’s presented exemplary plot—once again—raises doubt about their data. Note: The LRD plots include the data of several pulling velocities, and thus multiple unbinding force probability distributions. In the below example, the trimming was likely performed for all velocities before generation of the final LRD plot.
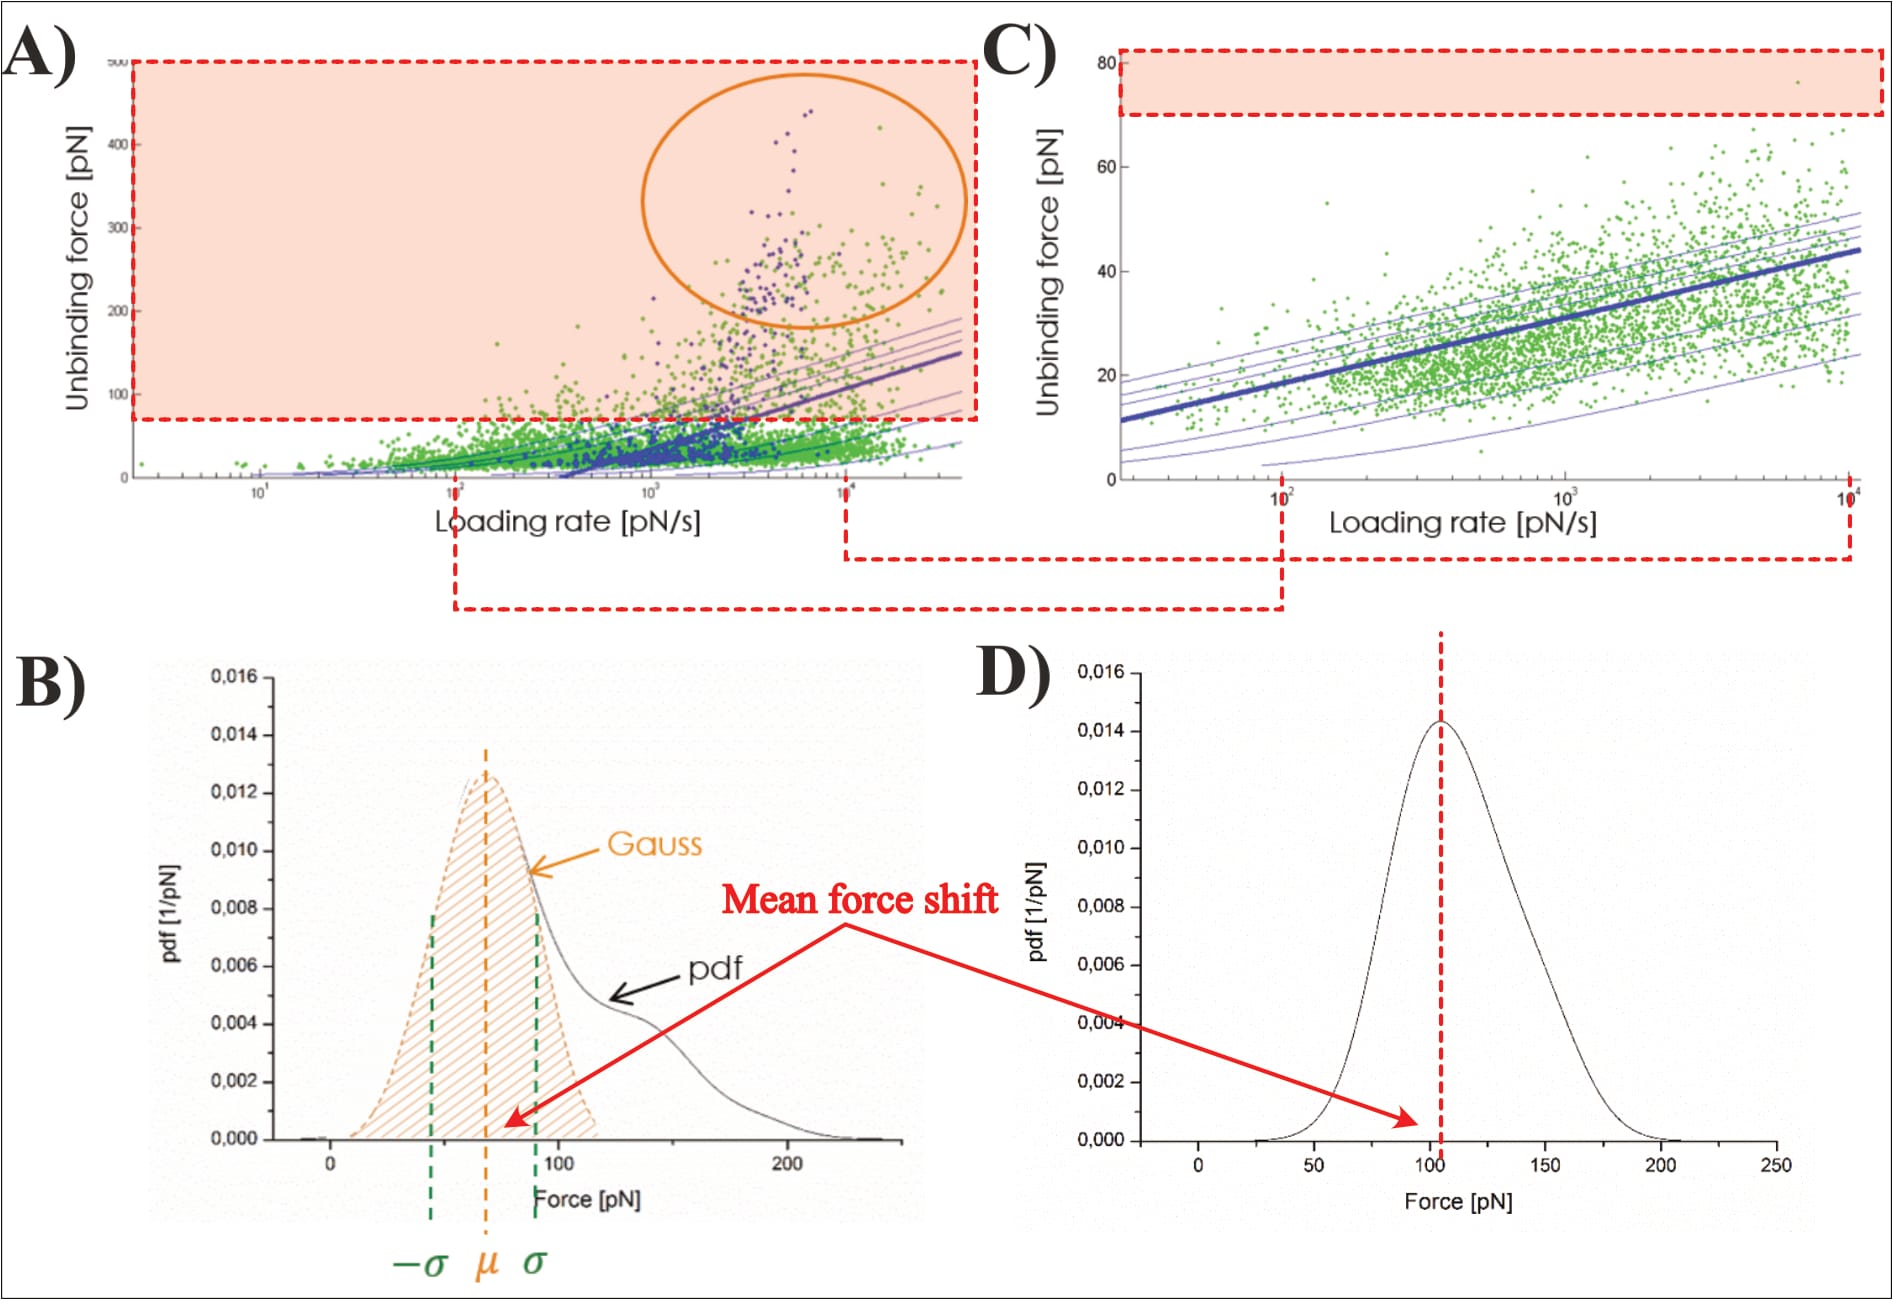
Clearly, Köhler’s mathematical fit changes significantly along the trimming: Before its unbinding force it grows from zero at a loading rate of ~3.5×10² pN/s, to roughly 150 pN at 3.5×10⁴ pN/s; afterwards its point of zero force is no longer visible (with ~25 pN at the equivalent loading rate), and remains below 50 pN for even at 10⁴ pN/s. Yet, somehow the removal of the data with higher forces somehow shifts the average unbinding force of the individual pulling velocity to a larger value (directly contradicting the claimed narrowing to the “first main peak in the force pdf”; Köhler, 2016, p. 26). In fact, the newly found average unbinding force (of ~100 pN) is never even reached by the shown LRD plot (which stays below 50 pN). Unfortunately, it cannot be discerned how many data points are actually removed in the process; Köhler provides no closer information.
It should also be mentioned that many of the shown data points have shockingly excessive unbinding forces of up to ~450 pN! Why such events were even identified as interactions is as unclear as it is worrying. Furthermore, the shown data cloud’s vast majority of data points is now suddenly narrowed to only two loading rate orders of magnitude, even though the fit’s original developers considered it “clear that the strengths of molecular linkages must be tested under controlled loading over a wide range of rates” to ensure accuracy, themselves considering 8 to 12 orders of magnitude (Bell & Ritchie, 1997). It warrants mentioning that Köhler, like Fis, fits their data with this model via the mathematical consideration of all individual data points (instead of the respective pulling velocities’ mean force values). Yet, the presented exemplary plot (of unknown experimental origin) shows data points only within one loading rate order of magnitude (Köhler 2016, p. 25, Fig. 2.8).
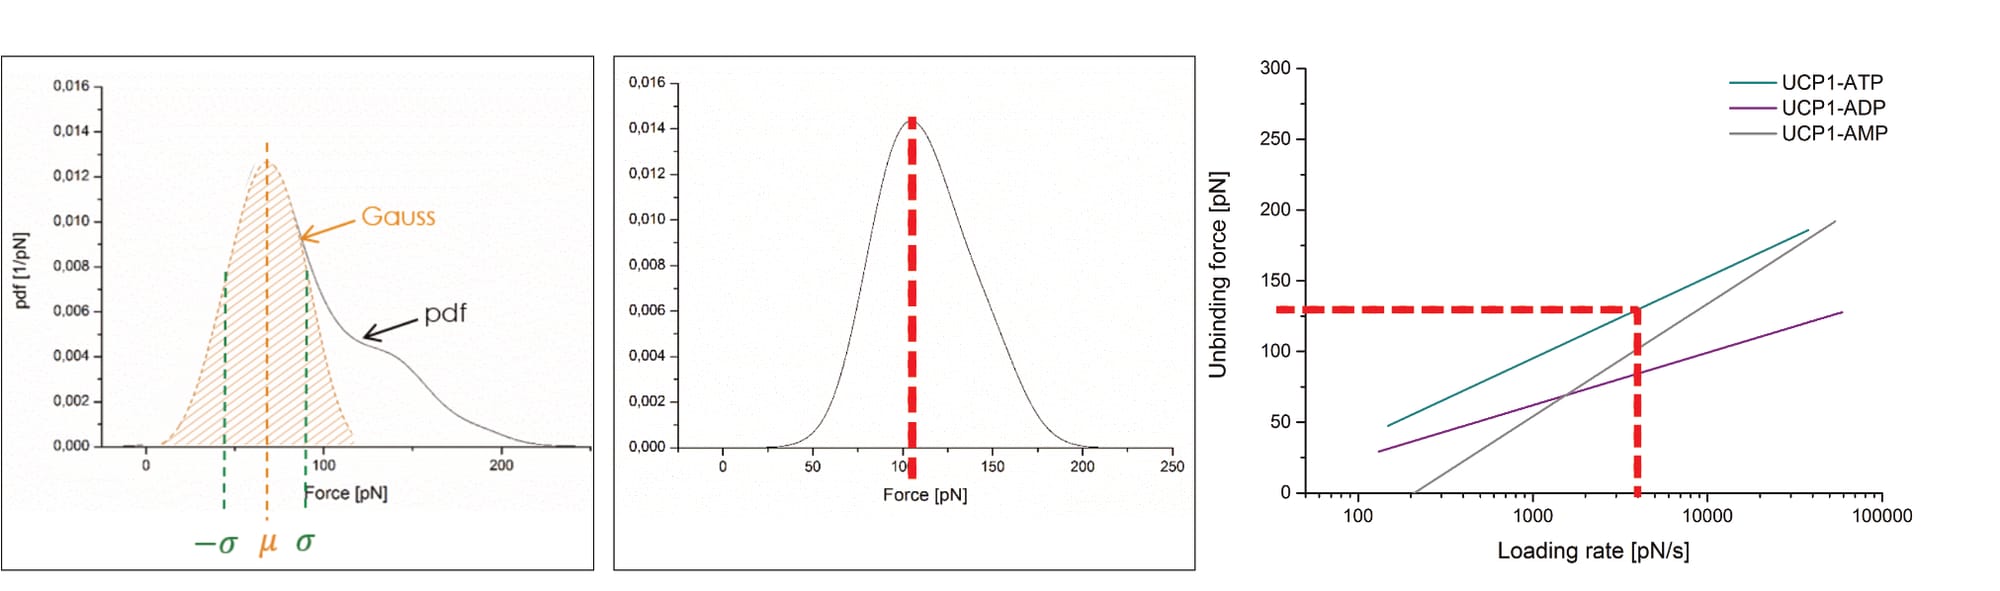
Critically, the provided exemplary figure can be identified, even though it is not itself labelled. Overlaying the shown probability distribution with the digitally stretched (to scale) measurement of the previously identified UCP1-ATP interaction (at 400 nm/s; see discussion above for experimental condition identification) reveals an essentially perfect overlap. Thus, the data is immediately pertinent.
Which raises another point of contention: The average unbinding force of the UCP1-ATP interaction (at 400 nm/s) is about ~70 pN before data trimming, then raises to slightly above ~100 pN. Yet, the final fit reaches about 130 pN at the corresponding loading rate (of roughly 3960 pN/s), almost twice the original measurement (Köhler, 2016, pp. 14, 26, 131, 132, 136). The point is not mentioned by Köhler. Note: The loading rate is the product of pulling velocity (400 nm/s) and effective spring constant (9.9 pN/nm; Note: the effective spring constant is only [!] provided for this exact measurement!), and thus 400×9.9=3960 pN/s (Köhler, 2016, pp. 14, 131).
Like Fis, Köhler provides no error bars, or any other quality-of-fit-indication. And while they do present at least one exemplary data cloud in an article publication (Köhler et al., 2017, Fig. 6), it is heavily trimmed: The final fit ranges from 10² pN/s to beyond 10⁴ pN/s, yet the data cloud is narrowed to only one order of magnitude (10³ to 10⁴ pN/s). Recall that the model’s original developers considered 8 to 12 loading rate orders of magnitudes. It is not explained why the data is only shown so selectively.
As the AFM only tracks its cantilever’s movement, the origin of any observed signal must be verified, which is typically done with so-called ‘block experiments’. In short, the targeted interaction is deliberately hampered “either by saturating the receptors on the surface or blocking the ligand(s) on the cantilever” (Köhler, 2016, p. 13; see also pp. 27, 28, 48, 49, 50, 57, 58, 69, 71, 83-86, 90, 134, 144, 161, 163). Even though the primary investigator previously considered it “mandatory that the specificity of receptor-ligand interaction be demonstrated by blocking experiments”, no such control is performed (Hinterdorfer & Van Oijen, 2009, p. 416). This is surprising, as the required blocking agents are widely available, relatively inexpensive purine nucleotides (e.g. ATP). Additionally, Köhler immediately proves these blocks were possible, as they do indeed measure such exact condition during the verification of a TREC signal (which is inappropriately trimmed, as further discussed below).
The sheer volume of issues in this force spectroscopy data—coupled with the fact that their exemplary plots stem from an immediately pertinent measurement—render Köhler’s results clearly unreliable.
Criticism re: TREC imaging
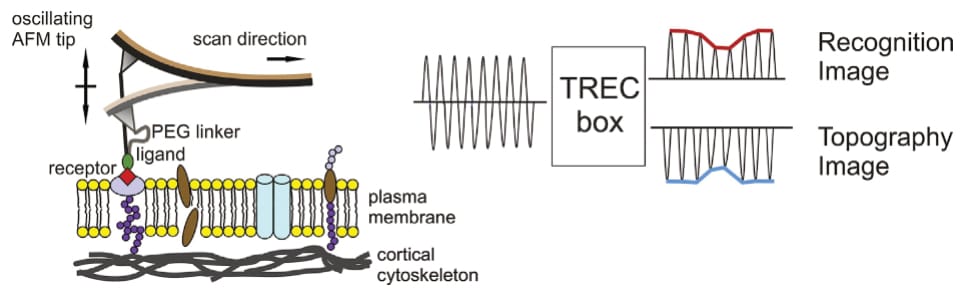
Beyond force spectroscopy, the thesis also investigates various proteins via imaging techniques. Some parts of the thesis showcase regular atomic force microscopy recordings (AFM; Köhler, 2016, pp. 45, 55, 56, 74, 76, 78, 79, 96, 97, 99, 100, 103, 106), others high-speed AFM (HS-AFM) images (Köhler, 2016, pp. 42, 46, 47, 52, 53)—all of which were collected in ‘tapping mode’, a method that minimises shearing forces. Instead of dragging the cantilever across the surface (like a gramophone), it is oscillated closely above, and the sample’s topography is extracted from changes in the oscillation amplitude. This is a very common application of the AFM, and Köhler’s respective images—at first—reveal nothing out of the ordinary.
However, Köhler then expands the technique by tethering a specific molecule to the AFM’s cantilever before measurement. Consequently, the cantilever’s oscillation amplitude is no longer only influenced by the sample’s topography, but also any specific interaction between surface and AFM-bound molecule—enabling the simultaneous visualisation of topography and interaction partners. Köhler uses this so-called ‘TREC imaging’ to identify membrane-embedded proteins in their sample (Köhler, 2016, pp. 44, 49, 50, 57, 81-84, 133).
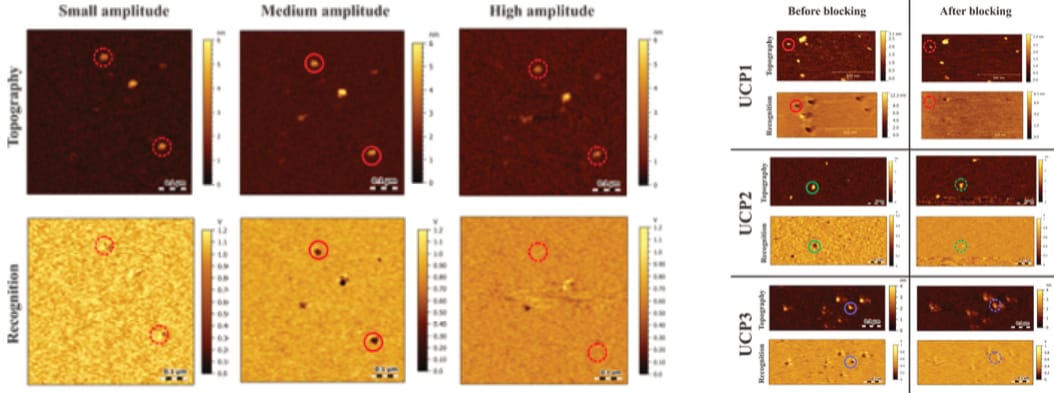
The first presented TREC recordings appear inconspicuous. Köhler even provides a rationale for the identification of observed interactions, by introducing a threshold (of amplitude reduction) that “has to be kept constant”, saying that “[o]nly when the recognition signal is below this threshold, the protein was considered to be recognized by the functionalized cantilever tip” (Köhler, 2016, p. 29; see also pp. 48, 49, 56, 57, 69, 90 and Köhler et al., 2017). However, this clarity then disappears, with later recordings not mentioning any threshold, and no explanation given. The consideration is simply…dropped.
While this sudden change in rigour is in itself surprising, its timing is worrying, indeed. It occurs at the exact moment the TREC recordings are expanded with force spectroscopy (Köhler, 2016, pp. 81-84, 133)—the very protocol Fis later adopts (for a much more fragile, complicated sample; an important difference, to which we will return). In addition, the corresponding (block-)control recordings are suddenly visibly trimmed—in contrast to all other images (Köhler, 2016, p. 84). Note: This type of (block-)control condition is itself unsatisfactory with regard to force spectroscopy, as discussed above.
Surely, there looms a question as to what causes these inconsistencies—and an answer is swiftly found, too: Köhler changes a pivotal AFM accessory, shifting from the previously used “AFM cantilevers with a magnetic coating (Type 7 MAClever from Keysight Technologies, Santa Rosa, CA, USA)” to “MSNL chips from Bruker Corporation (MA, USA)” (Köhler, 2016, pp. 86, 111; Note: Fis later employs MSNL cantilevers only.). Even though Köhler documents this alteration in the respective materials and methods-sections, they nowhere discuss its many ramifications, implicitly assuming their measurement can commence unaffected. But this is demonstrably wrong—and at long last the culprit is found.
TREC imaging requires the cantilever to oscillate near its resonance frequency, and was originally developed with magnetic excitation, the “standard […] in TREC” (Köhler, 2016, p. 31; see also e.g. Stroh et al., 2004a; Stroh et al., 2004b; Ebner et al., 2005; Preiner et al., 2009). The so-called MAC-mode is “considered more handy and sensitive” because it allows for a highly selective cantilever excitation “as a single prominent resonance peak is detectable” during measurement preparation (Fis, 2018, p. 13). In contrast, MSNL chips (that lack magnetic coating) are excited acoustically, which “has some drawbacks compared to MAC mode”; for example the “mechanical excitations of the microscope” (Köhler, 2016, p. 9). In essence, acoustic excitation introduces the vibrational frequency with which the cantilever is excited into the entire measurement chamber. How this affects the measurement is unclear, with (potential) effects left undiscussed.
Other significant ramifications become apparent when considering the cantilevers’ physicality: MAClevers are individually mounted to chips, MSNL cantilevers in groups.
![Figure 10: Comparison of the two different cantilever chips (edited after Köhler, 2016, pp. 62, 87; images originally provided by manufacturers \[Keysight Technologies and Bruker], but respective websites no longer available). Whereas the used magnetically coated cantilevers are individually mounted to chips, the employed MSNL cantilever is mounted in between four others on the same chip.](https://cdn.synaps.media/micsa/content/images/2025/10/Fig-10_Ko--hler_cantilever-comparison.jpg)
Consequently, the only introduced vibration for MACmode measurements stems from the used cantilever itself, and it is directly observed. In contrast, the acoustic stimulation of an MSNL cantilever also causes the entire measurement chamber as well as four unobserved cantilevers to vibrate—which in turn introduces several unpredictable (because unnoticed) sources of perturbations. Importantly, the unobserved cantilever B has the same nominal resonance frequency as the used cantilever D (at 15 kHz, according to the manufacturer), and is thus (theoretically) equally excited. The introduced turbulences immediately precede the measuring cantilever half the time, and immediately follow it the other half (as the cantilever moves laterally back and forth during measurement). Whether (and how) these perturbations influence the measurement is, of course, nowhere considered.
This consideration becomes particularly worrisome in combination with another critical factor: cantilever length. The employed “PicoPlus 5500 AFM from Keysight Technologies” (Köhler, 2016, p. 68; also used by Fis, 2018) is “designed to hold the probe at either nine degrees or eight degrees from horizontal” (Keysight 5500 Scanning Probe Microscope User’s Guide, 2014, p. 35). Thus, longer cantilevers touch the surface before shorter ones do, and remain in contact with the sample throughout any measurement.
(Note: The principle is easily demonstrated using one’s own hand: If the hand is held perfectly parallel [i.e. horizontal] to an approaching surface [e.g. a tabletop], the palm and all fingertips will touch it at the same time. If the hand is tilted [fingers slightly lowered, palm slightly elevated], the longest finger will touch the surface first.)
This design is highly practical in many contexts, as longer cantilevers typically have softer spring constants. So, while the longer MSNL cantilevers are indeed constantly scratching about the sample during recordings with shorter ones, they theoretically introduce less damage than the used cantilever itself. If (!) the surface withstands the employed shearing forces without problem.
It thus needs consideration that Köhler’s (here relevant) recordings were all collected with MSNL cantilever D, supposedly the only one that satisfies the conflicting spring constant demands of imaging and force spectroscopy (though no concrete evidence for this claim is presented). This cantilever’s (nominal) length of 225 µm is clearly exceeded by the flanking cantilever C’s 310 µm. Consequently, Köhler’s sample surface is constantly exposed to obscure shearing forces during all measurements (both imaging and force spectroscopy). Their sample, meanwhile, consists of a single lipid bilayer, the stability of which is unclear (and not discussed in the thesis). The thesis does not contemplate whether surface remnants are loosened during measurements (and then stirred up by any of the present perturbations), much less the consequences of this possibility. As extensively mentioned above (and exhaustingly self-evident), maintaining sample health is absolutely critical.
It should at this point be clear that the magnetically coated cantilevers (with which TREC was originally developed) avoid many serious problems that MSNL chips introduce. Consequently, Köhler’s unmentioned (yet implicitly obvious) assumption that their accessory alteration needs no further consideration, is unsettling, to say the least.
Criticism re: incomprehensible results
As is the case for Fis (2018), the here detailed criticism is not exhaustive. For example, some final fits imply repulsive forces (at rest) between the constituents, which contradicts experimental design (Köhler, 2016, p. 136, Fig. 4.16), and the only presented effective spring constant seems unreliable. Its value of 9.9 pN/nm is explicitly mentioned for the UCP1-ATP measurement, which at 600 nm/s pulling speed finds a maximum unbinding force of 105 pN (Köhler, 2016, pp. 131, 134). However, the experiment’s final result reaches that force at a loading rate somewhere between 1000 and 2000 nm/s (Köhler, 2016, p. 136). Since the loading rate r is the product of pulling velocity v and effective spring constant k (r=v×k), the latter can easily be double-checked with the given results (as k=r/v). And that calculation yields a spring constant somewhere between 1000/600=1,667 pN/nm and 2000/600=3,333 pN/nm; a drastic reduction.
Considering the many issues in the presented exemplary data, it is unfortunate that Köhler—as Fis—omits so much information that would allow at least an estimation of data reliability, for example:
- effective spring constants,
- cantilever spring constants,
- exact measurement parameters,
- selection criteria to identify interaction events (with the only shown example highly problematic, as discussed above),
- data trimming effects,
- data clouds,
- error bars,
- quality-of-fit indicators,
- exact sample sizes, and
- kspec plots.
Nonetheless, it should be explicitly highlighted that Köhler’s thesis—despite everything—appears significantly more scientifically valid. It is far more detailed, enabling data scrutiny that is simply impossible for Fis. This is a hallmark of any scientific publication, and should be treated as such. Additionally, their thesis contains much more information than here discussed, as those data are not pertinent for the present topic (and though I did not review those parts in detail, they appear entirely unproblematic at first glance). Lastly, the thesis’ many experiments become increasingly complex as they progress, with the problematic approach (using MSNL cantilevers) only beginning on page 115. Presumably, Köhler’s expertise centres around high-quality (TREC) imaging, not force spectroscopy. It is thus conceivable that they simply overlooked the cantilever change’s significance. Additionally, their experimental setup is (theoretically) much more forgiving than Fis’ later approach. Köhler deposits a lipid bilayer onto mica, which can be expected to be (relatively) stable (considering the electrostatic properties of the used lipids and buffers). Any damages to their surface—and there is plenty of reason to suspect such did indeed occur throughout measurements—should have relatively little repercussions, as any loosened debris would be expected to either swiftly merge with the membrane again, or form rather small micelles (or vesicles). Hence, the sample may have appeared continuously healthy in TREC images (despite the lower quality caused by the cantilever change), even after damaging.
Of course, these contemplations do not weaken any of the voiced criticism. They merely open a tentative avenue of understanding how the situation might have unfolded. Considering that a 2017 publication of Köhler et al. specifically announces the combination of TREC imaging and force spectroscopy as a new mode of investigation (by use of the same data), extensive discussions of all here mentioned issues should be readily available (a point that extends to all other publications regarding these data).
Lastly, it seems obvious that Fis was even more negligent regarding the impact of MSNL cantilevers in their measurements. They adopted the “combination of two techniques, TREC and SMFS [Note: single molecule force spectroscopy], […] suggested by Köhler et al.” in 2017 (Fis, 2018, p. 25). However, they used a much more complex, fragile sample, which is likely destroyed during measurement even as things stand (without the here mentioned issues, as discussed elsewhere). The above described scratching across the surface with an unobserved cantilever (exerting obscure forces), only adds to already existing concerns. Especially considering that Fis’ multi-layered sample is deliberately assembled in a tightly controlled fashion to ensure they can investigate their targeted protein in the first place. In stark contrast to Köhler’s approach, any damages to Fis’ sample are permanent; their surface cannot easily reform. Any loosened debris is unpredictable, consisting of various lipids, streptavidin, and membrane proteins, all more or less interconnected with deliberately introduced bonds (of significant strength, as previously mentioned)—and the acoustic excitation of MSNL cantilevers causes the entire measurement chamber, and all four unobserved cantilevers to vibrate, meaning all of it is continuously stirred and mixed. Under the here introduced considerations, it appears even more dubious that Fis provides no evidence of sample stability (or constitution) whatsoever, and consistently omits all relevant data.
In any case, after close consideration of both Fis’ and Köhler’s theses, it is clear that their (here pertinent) results are entirely unreliable, as all (!) their shown data contain obvious, often undeniable signs of problematic measurements. In the majority of cases, these issues regard their chosen approach’s very fundamentals (e.g. signal identification, appropriate measurement parameters, or control conditions), leading both researchers to contradict their own findings even within their own documents—on essentially every single here mentioned point of criticism. To top things off, the reason for these problems can be identified, and its moment of inception pinpointed.
Now that we have unraveled the technicalities, it is time to return to a more elevated position, enabling us to trace these issues across time—compelling far bigger questions, and ugly answers, indeed.


