Dismantling a thesis
The next publication on our retrograde path laid the foundation for the project's future, and is thus the most critical. Actual data is still eerily scant (especially for a PhD-thesis), and what little is provided is either unconvincing, or contradictory—and even just a glance reveals it.

According to the thesis, Fis followed a previous lab member’s elaborate experimental setup that aims to mimic the investigated membrane-protein’s native environment. In short, the surface constituent (SecYEG) is embedded in a lipid bilayer that is elevated above another. The two membranes are separated by a firmly tethered grid, built by a well-researched and widely used protein (streptavidin). This multi-layered approach provides empty pockets between the two bilayers, where SecYEG can orient itself naturally in the top membrane—without pressure, electrostatic forces, or other interference from below (or above). However, SecYEG can’t move because the tightly-knit middle layer holds it in place.
This experimental design was originally developed on a so-called high-speed atomic force microscope (HS-AFM), which has a much faster feedback loop, and thus drastically lowers the risk of introducing sample-destroying shearing forces. Even so, assembling the sample surface is challenging and the end-result fragile, leaving the original developer to explicitly state how critical high-quality layer formation is. According to them, full assembly is “hindered by defects in supporting layers” (Karner, 2018, pp. 39, 59).
Fis transferred the protocol to a regular AFM, which comes with significant hurdles that are nowhere discussed, as further analysis will reveal. But for now, let’s focus on their claimed findings. Supposedly, they (1) imaged these fragile surfaces, (2) identified SecYEG locations, and then (3) performed force spectroscopy measurements to investigate various interactions.
Criticism re: (1) surface imaging
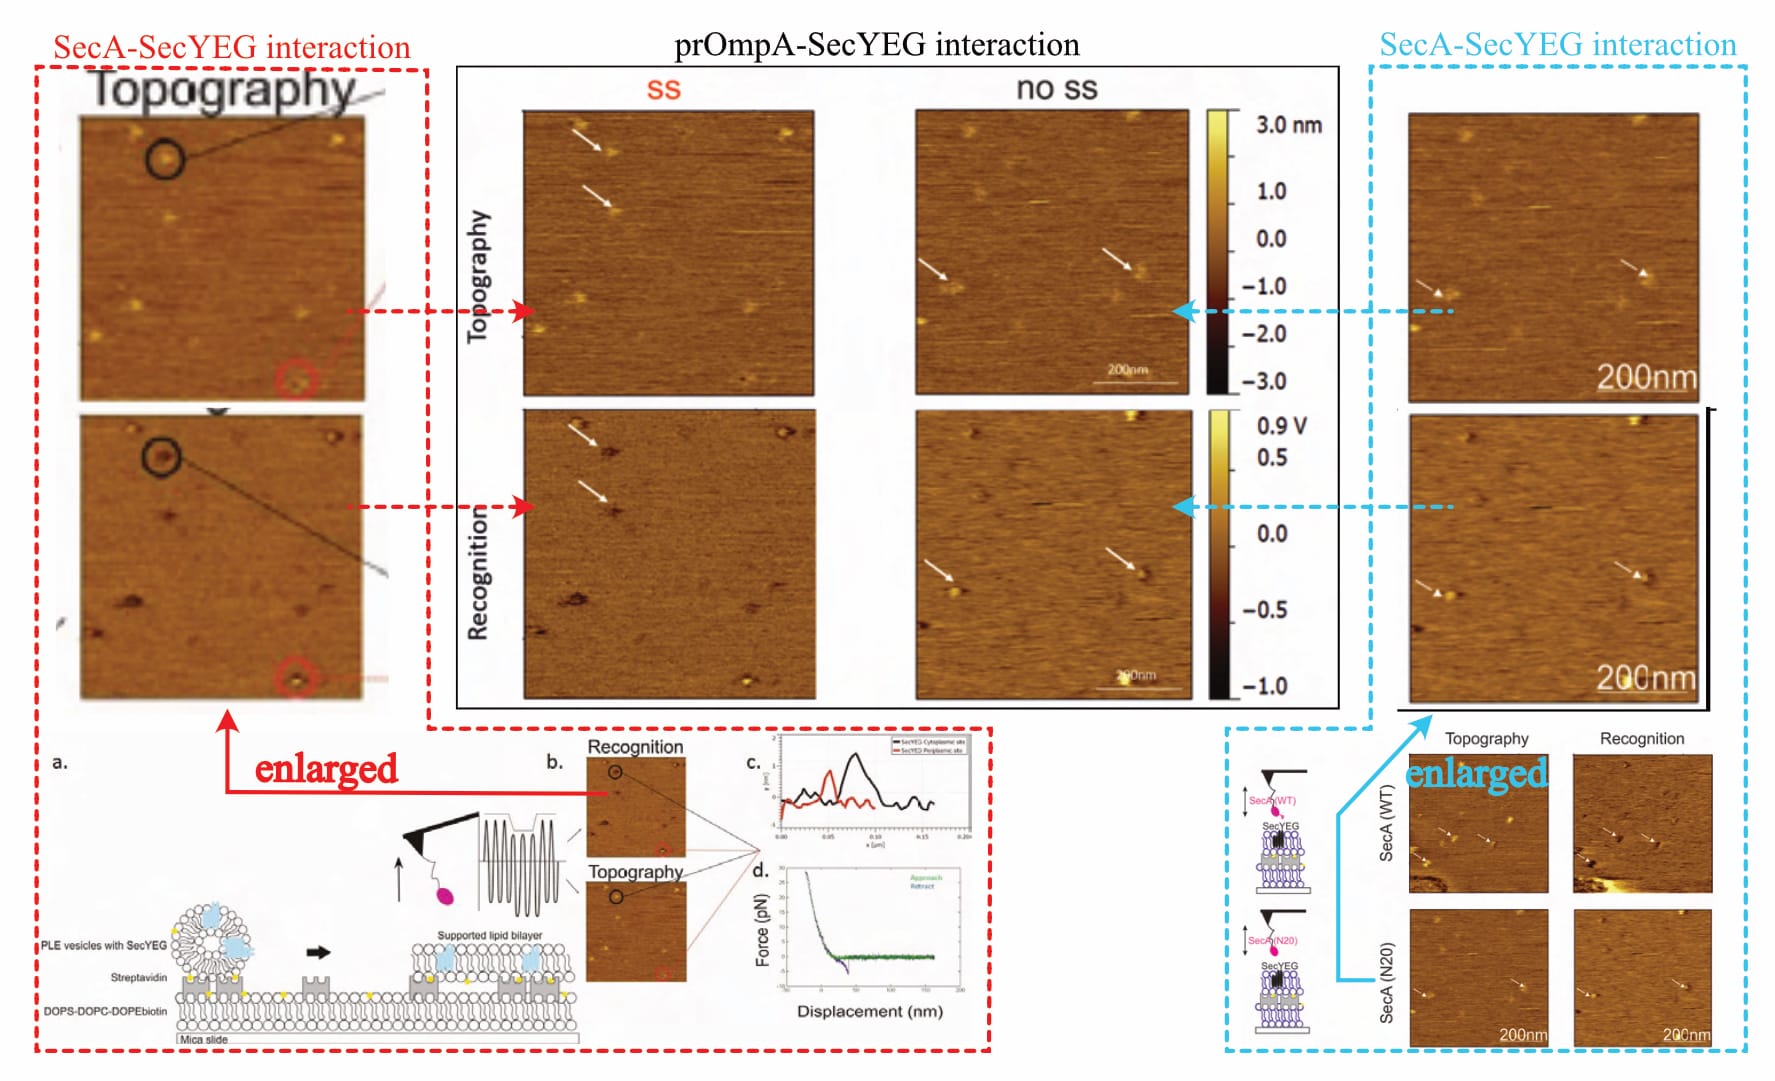
Despite claiming the “establishment of a functional sample preparation” (Fis, 2018, p. 47), no evidence of successful layer formation is provided. There are only five (!) recordings shown: One to show the method’s measurement principle (Fis, 2018, Fig 5.2), and four actual results (Fis, 2018, Fig 5.6 and Fig. 5.16). However, a closer look reveals that actually, there are only three (!!) different images, as two of them are repeated (!!!) for different experimental conditions. The exemplary one (supposedly of the SecA-SecYEG interaction) is identical to one experimental result (where it is suddenly the prOmpA-SecYEG interaction). Likewise, the recording shown for a mutant SecA variant (SecA•N20-SecYEG interaction) is later the interaction of a mutant prOmpA (prOmpA•Δss-SecYEG). In the original document, the recordings are always presented in different orientations, making it difficult to directly compare (topography/interaction channels once bottom/top, once top/bottom, and once left/right).
As force spectroscopy measurements quickly take several hours, Fis claims to have extensively verified sample integrity during experiments, not least to ensure the interaction partners remain within one another’s reach. Considering the collection of “close to 14000 curves, as ~1200 curves were acquired at 11 different pulling velocities” for each of the 13 experimental conditions, and sample health verification “every ~200 curves” (Fis, 2018, pp. 25 and 39), between 858–3861 images were supposedly collected. None are shown.
(Note: The large range results from ambiguity in the protocol description. It is unclear whether Fis collected 1200 curves per pulling velocity and experimental condition for each of the supposed “four to five different cantilevers”, or whether the 1200 are the sum total of all cantilevers for each velocity and condition. Typically, sets are collected in full for each cantilever, meaning the larger number is the more likely. Calculation: (1200·11·13)/200=858, and 858·4.5=3861)
Of note, one of the provided images shows a very obvious defect in the lower-left corner (Fis, 2018, Fig. 5.6, top row—or compare Figure 1 above, bottom right, top row), even though the original protocol developer warns against exactly such. It is—of course—not addressed.
Considering the sample’s complex assembly and fragile nature, there is much more to say about the imaging process. Unfortunately, Fis simply shows too little to properly debate it, and we will thus have to return another time—which, ultimately, will reveal the moment things turned sour.
Criticism re: (2) identifying SecYEG locations
After imaging, Fis focuses on individual locations of (SecYEG) protein protrusions to identify suitable interaction partners for their (SecA- or prOmpA-functionalised) cantilever. They achieve this by simply evaluating the protruding protein’s height profile, claiming that “only the SecYEG proteins with their cytoplasmic site facing upwards (average height ~1.2 nm), produced a recognition signal (SIC)”. It is indeed the case that an interaction is only expected in this orientation, but how Fis dependably identifies it is unclear. No analysis procedure is mentioned, nor are any results or statistical parameters presented. That leaves only the extraction of the protrusions’ heights directly from topographical recordings during measurement, which cannot be verified and is nowhere reported.
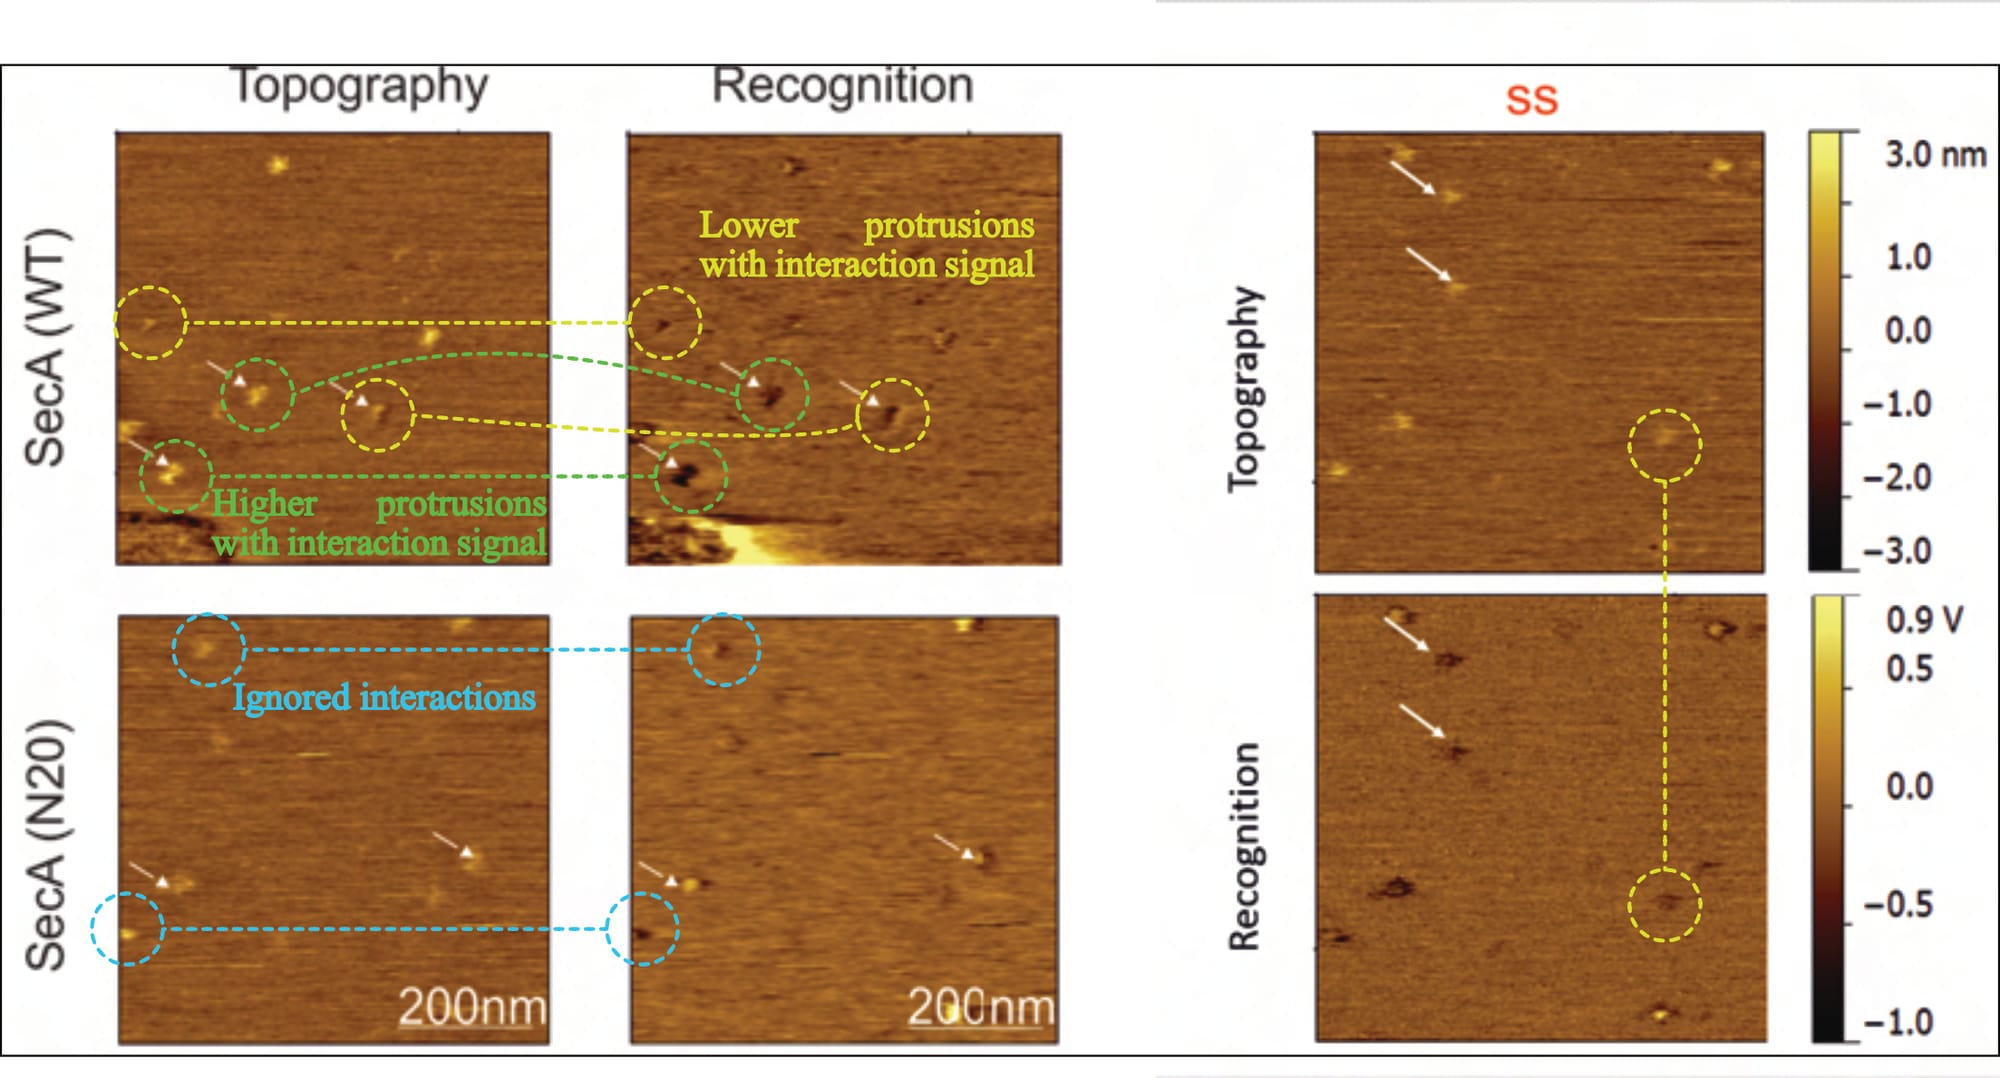
Typically, varying values in the z-axis are colour-coded, with a corresponding scale provided alongside the images, but the given information is entirely unsatisfactory. While there is no z-axis scale whatsoever for SecA-SecYEG recordings (Fis, 2018, Fig. 5.6), only one is presented for two prOmpA-SecYEG results (Fis, 2018, Fig. 5.16). And even though its range makes it difficult to reliably identify height discrepancies with the necessary accuracy (~0.7 vs. ~ 1.2 nm), it shows clear cause for concern: There are obviously various protrusion heights (that is, spots of varying brightness in the topography channel) for which recognition signals are visible (darker spots in the recognition channel). Fis even highlights them indiscriminately (with white arrows in their figures), contradicting their own claims.
Thus, it is not only unclear what experimental conditions the images reflect (as elaborated above), but also whether the supposed interaction signal even corresponds to the correct SecYEG orientation (of note: an interaction is not expected for the periplasmic side and would contradict established literature).
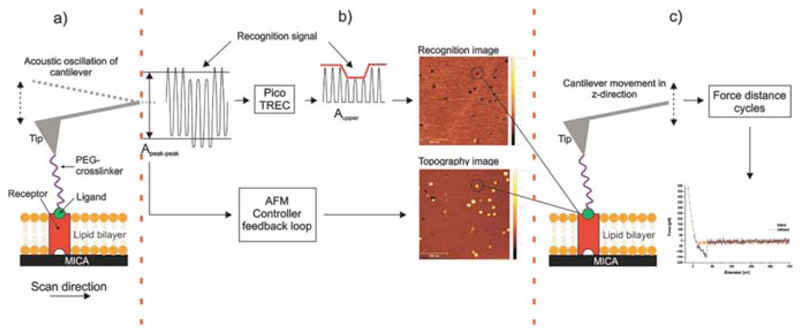
However, the perhaps more interesting point on this supposed recording of membrane-embedded SecYEG proteins is the signal shape itself. As elaborated elsewhere, the image is produced by observing an oscillating, functionalised cantilever’s amplitude closely above the surface. The logic is simple: If something holds the cantilever back (i.e. an interaction takes place), its oscillation is dampened. If not, it swings freely.
But in Fis’ case interaction occurs everywhere because the cantilever-tethered molecule interacts not only with SecYEG, but also the membrane itself—as they themself measured in previous sections of the very same document (and is widely reported in subject literature)! Thus, the cantilever’s oscillation should be dampened for the entire duration of the measurement.
A distinct signal at specific locations (e.g. SecYEG proteins) only makes sense if the oscillation is dampened even further, meaning the cantilever-tethered molecule would have to be at an ever deeper position—in this case, it would have to dive into the membrane. This entirely surprising (and unexpected) result, which once again is neither discussed nor mentioned, directly contradicts a vast amount of literature, e.g. the experimental setup’s original developer: They, as other findings also suggest, found that “SecA is sitting on top” of SecYEG during interaction (somewhat hopping on and off; Karner, 2016, p. 48). Thus, there should be no signal. In fact, an inverse signal is more likely: With the cantilever-bound molecule suddenly elevated above the membrane (on top of SecYEG, which protrudes the surface), the cantilever is free to swing further upwards (and is only held back later than happens for the surrounding membrane signal).
However, if SecA and SecYEG do indeed spontaneously interact (as a wealth of literature agrees), their affinity may well affect the oscillation through a lateral distortion: When the two proteins are close enough for interaction, SecA is drawn towards SecYEG. (In a native environment, SecYEG is membrane-embedded, whereas SecA moves about freely ‘searching’ for interaction partners. In this experimental setup SecYEG is locked in place, leaving only SecA able to move.) The resulting pulling force may indeed dampen the cantilever’s oscillation, due to linker-stretching—it would just not pull downwards, but laterally away.
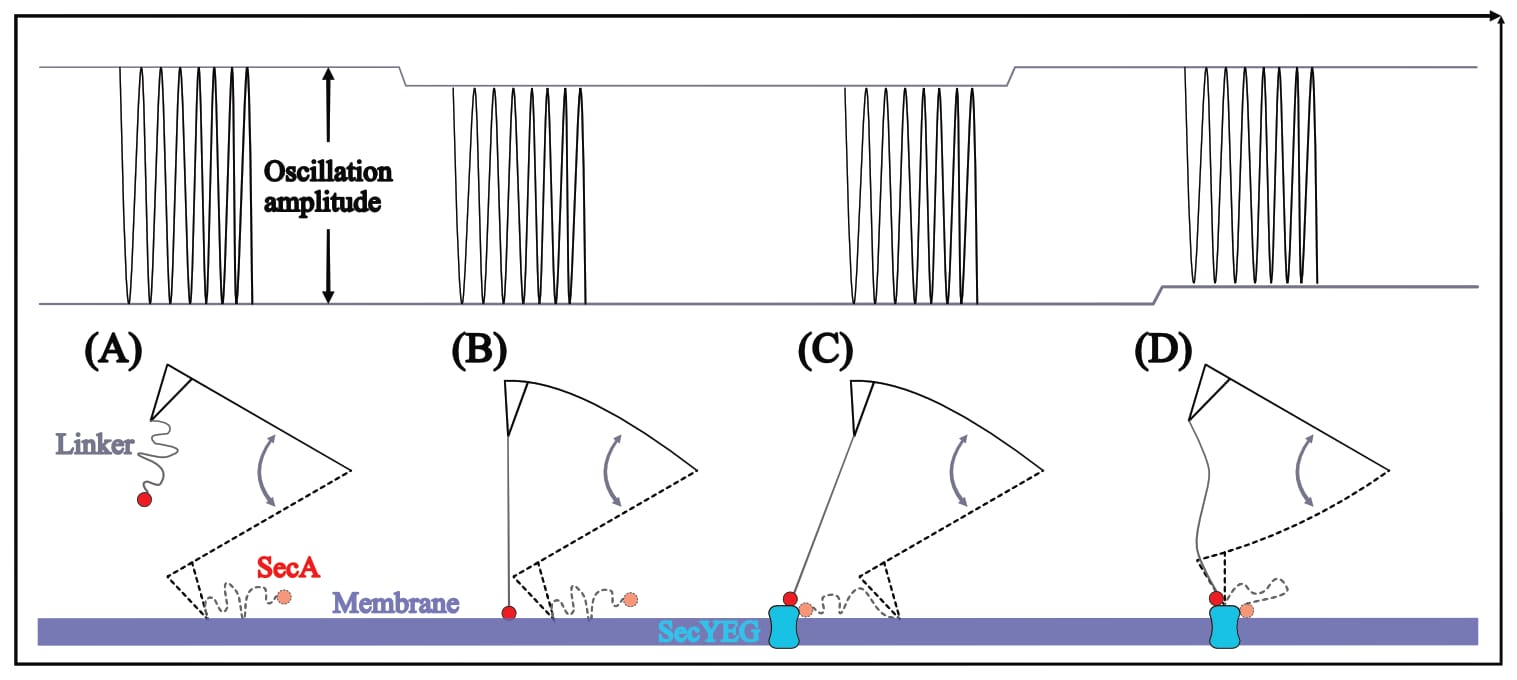
In this scenario, the resulting recognition signal should be similar to a doughnut-shape: The cantilever’s oscillation should be dampened (darker signal) near SecYEG, but then either un-dampened or even larger directly above SecYEG (brighter signal)—and indeed this exact signal shape is found in all of Fis’ recordings.
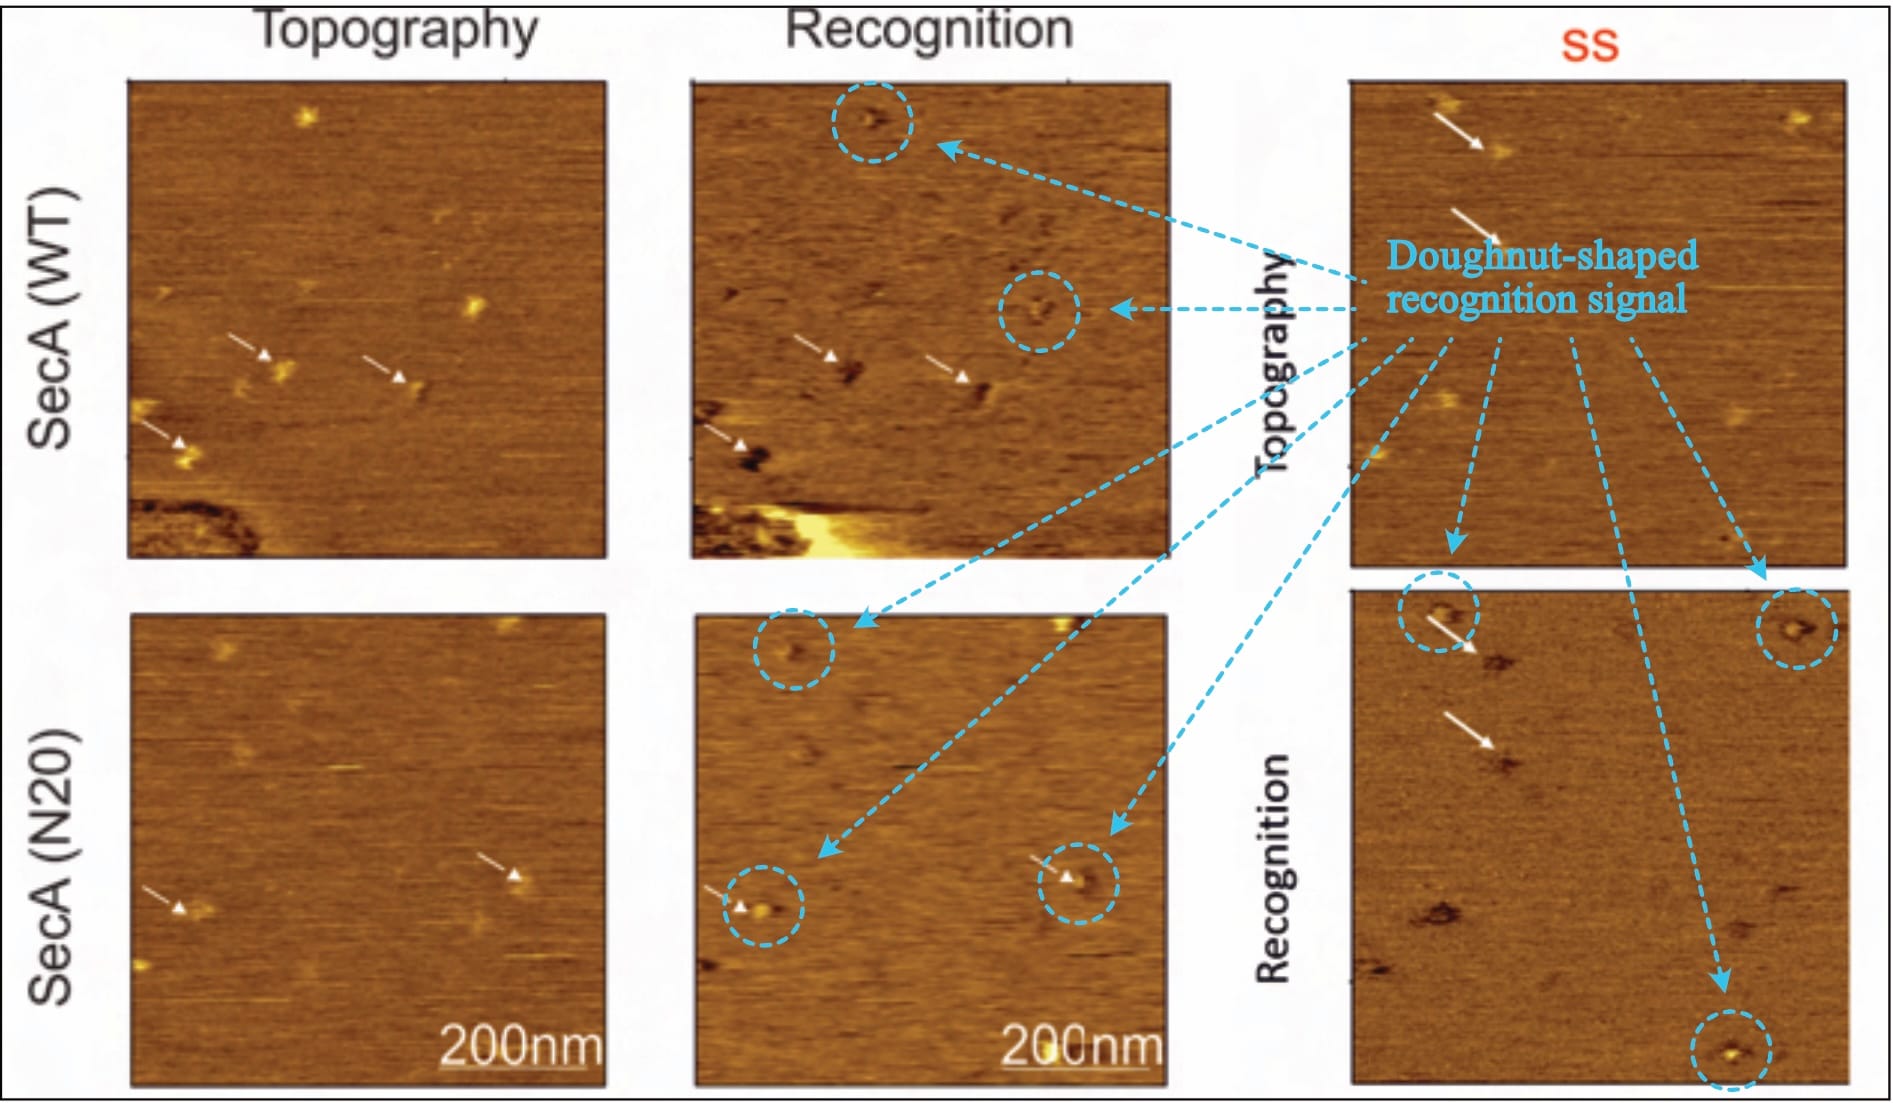
Thus, it is unclear what experimental conditions the images reflect, what the topography signal shows, and what results can be extracted (as the theoretically expected signal is simply ignored). However, it is clear that this doughnut-shaped interaction also occurs for Fis’ (inappropriate, as we will find out) control condition: the SecA•N20 mutant—which is not actually surprising, considering that current literature overwhelmingly suggests that this (N-terminally truncated) mutant has lost its ability to interact with the membrane, not SecYEG.
The thesis, unsurprisingly, at no point considers any of this.
Criticism re: (3) force spectroscopy measurements
As their last stage of investigation, Fis performs force spectroscopy at the ‘identified’ interaction sites. The procedure here is to repeatedly bring the functionalised cantilever into contact with the surface, before observing whether it is held back during retraction (as detailed elsewhere). If the cantilever-tethered molecule and the (protein on the) surface interact, a distinct signal shape ensues—which is crucial to ensure the observed interaction actually stems from the two molecules, and is not confounded. This “characteristic parabolic force profile” which “arises from the non-linear stretching of the linker”, with an “extended length in solution of about 6 to 9 nm” (Fis, 2018, pp. 18, 19, 26) represents the method’s fundamental quality control. Fis clarifies as much in two dedicated figures (Fis, 2018, pp. 18, 20), while Köhler states that “the most crucial profit of stretchable cross linker is the possibility to clearly distinguish between unspecific adhesion and specific binding events” as this allows to “distinguish between specific binding and unspecific adhesion” (Köhler, 2016, pp. 20, 131). However, Fis provides no exemplary measurement of their own experiments.
The only individual ‘force distance curve’ (FDC) is part of a figure that explains the experimental approach, supposedly by example of a SecA-SecYEG interaction (Fis, 2018, p. 47, Fig. 5.2). Yet, in their joint-publication, that same FDC is presented alongside Köhler’s UCP1-ATP interaction (Köhler et al., 2019, p. 3, Fig. 1; Note: Recorded images identical to Köhler, 2016, p. 81, Fig. 3.32, where the experimental condition is explicitly described.) and another exemplary FDC is presented for Fis’ experiment (Köhler et al., 2019, p. 13, Fig. 4)—and this example does not at all show the all-defining parabolic signal shape.
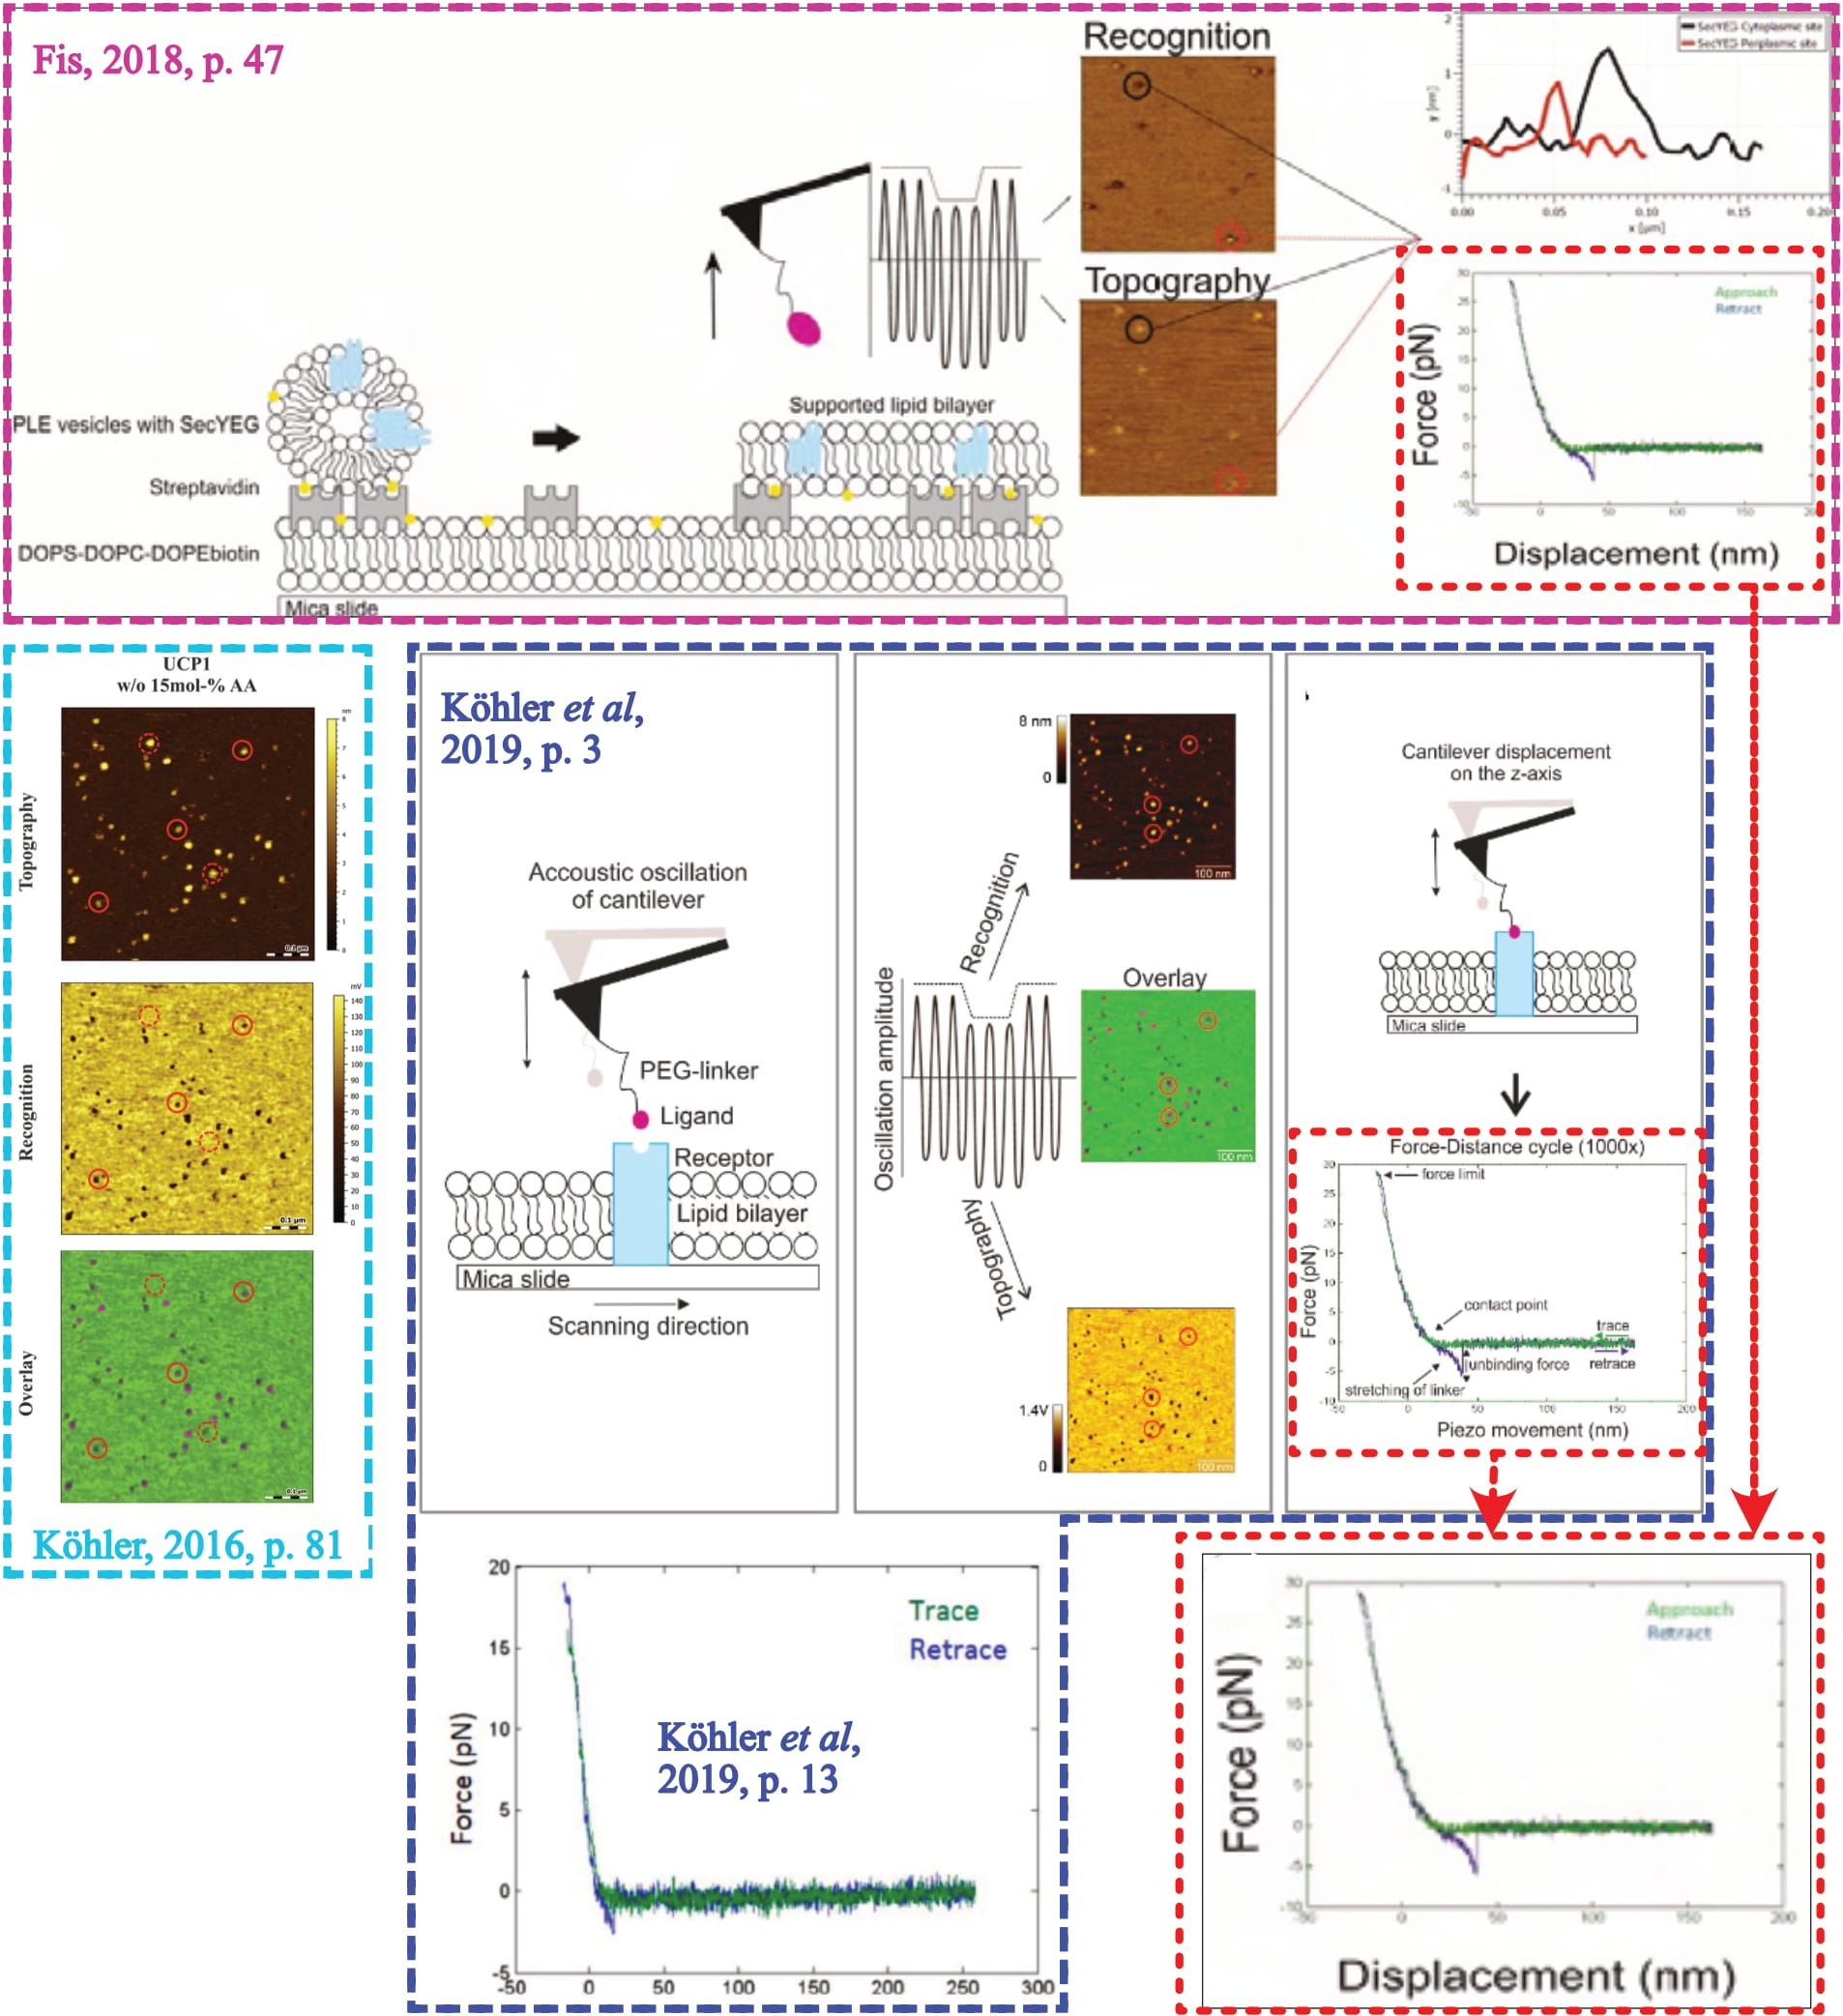
Hence, it is unclear who measured that representative curve, and from which condition it originates. The second shown FDC must be dismissed because it is clearly not parabolic, and thus uncertain what caused the signal.
There is also another reason to disregard these FDCs: their indentation forces. It doesn’t need much explanation that minimising the chances of sample damages is absolutely crucial during all measurements. Thus, the maximum force with which the cantilever is pushed onto the surface during force spectroscopy is tightly controlled. As Fis elaborates, it “should be kept as low as possible in order to prevent damages of the sample” (Fis, 2018, p. 18). While the individual curves’ maximum applied force remains below 30 pN, it reaches an excessive ~900 pN (!) in the only provided graph for the next step of data analysis shows (see Figure 7 below). Crucially, data curves with diverging settings for the maximum force value cannot be processed together; important information that only those who have used the department-internal software know.
Of note: Two of the department’s more recent graduates denote decidedly lower indentation force limits (Diethör, 2022, pp. 34, 53; Suh, 2022, p. 129), explicitly mentioning to do so in order to “prevent a too high number of forced unspecific interactions” (Diethör, 2022, p. 53) and “minimise adhesive or unspecific events” (Suh, 2022, p. 129). These theses display maximum indentation forces “below 80 pN” (in live cell measurements; Diethör, 2022, pp. 41 Figure 26, 53) and below approximately 60 pN (in mica-mounted measurements, as also used by Fis; Suh, 2022, pp. 76-77). One of the theses even discusses the consequences of large indentation forces and the subsequent exclusion of data due to confounded measurements after indentations of 400-500 pN (Diethör, 2022, pp. 41-42, 47), only half of Fis’ non-discussed indentation force.
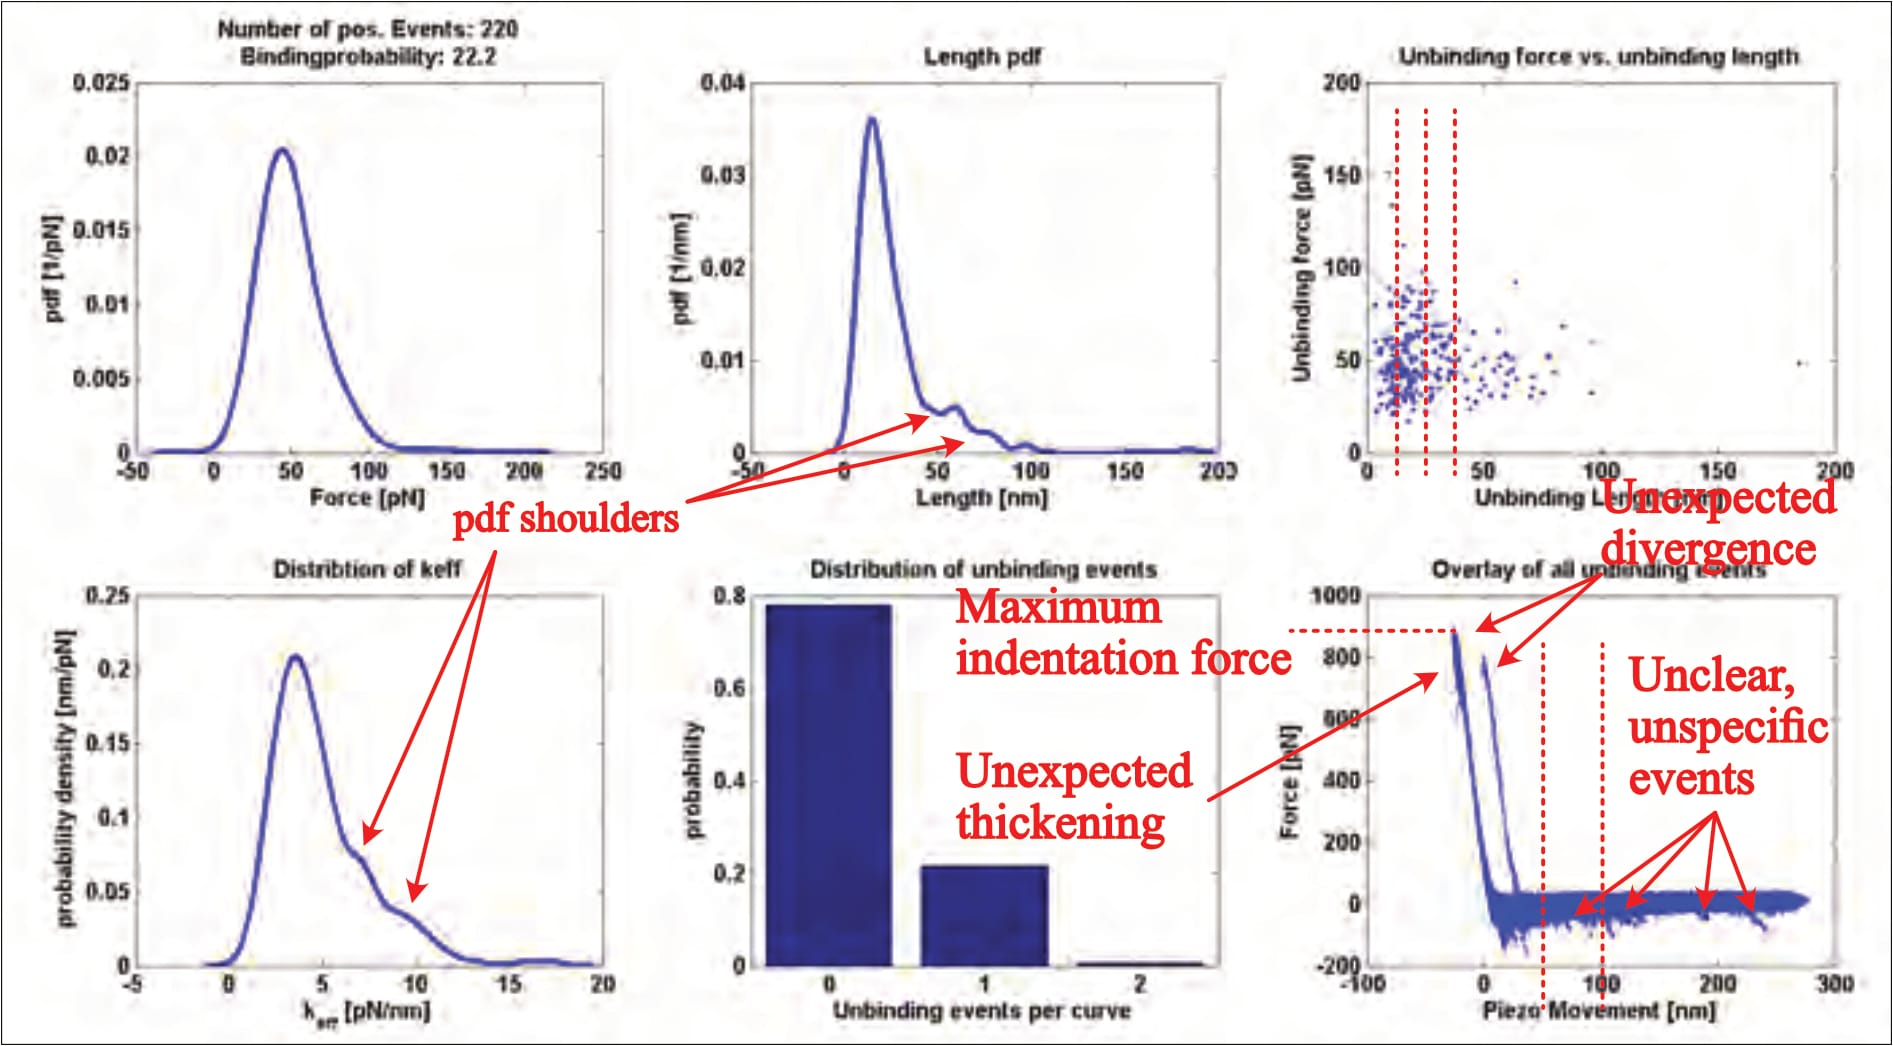
After data collection, the individual (approximately 1200) FDCs are examined, and any supposed interaction signals selected and fitted with a mathematical model (no example of which is provided). These highlighted ‘unbinding events’ are then grouped and statistically analysed, yielding a six-panelled ‘kspec plot’ that provides insight. Fis’ only provides one such result (without clarifying the experimental condition), which shows a multitude of worrying issues:
- The overlay (bottom right panel), for example, shows several interactions (downward peaks in the horizontal part of the curves) at distances of up to 250 nm, far beyond the linker’s expected length (of 6-9 nm; Fis, 2018, p. 26). These events indicate something pulling the cantilever down during its retraction, meaning an unidentified force acted upon the cantilever up to this point of the measurement. A thusly confounded measurement should cause the FDC’s immediate dismissal because it is unclear how this obscure factor influences the targeted interaction.
- Even though all events should occur within the linker’s length (6-9 nm), many interactions with far greater distances were clearly selected for analysis, as their datapoints are visible in the top right panel. Others were not. No rationale for in-/exclusion is provided; the issue is not touched upon.
- It is also entirely unusual to see two distinct indentation areas (the almost-vertical part of the curves) in the overlay. Though it can only be speculated what caused this divergence, it is clear that it makes the dataset utterly unreliable, for a simple reason: The curves’ horizontal/vertical transition point reflects the moment the cantilever reaches (or leaves) the surface, and is the orientation point for all further analysis—regarding not only the extracted unbinding force values, but also the unbinding lengths (which must be either drastically exaggerated or truncated for one part of the dataset). I have never seen this issue anywhere else, and it should be seriously questioned why anyone would willingly choose such an obviously problematic plot as the sole and representative result in a PhD-thesis at all.
- The indentation area (almost vertical part of the curves) thickens both at the top and close to the contact point, indicating sudden cantilever movements. Considering Fis’ surface composition, the (by far) most likely explanation is a puncturing—and thus destruction—of the sample during measurement.
- There are also several shoulders visible in the probability distributions. Though far less significant of an issue, this indicates multiple interaction regimes. It is unclear whether still following data trimming causes the exclusion of these data points or not.
- As previously discussed, the indentation force is absolutely excessive.
- There is significant noise in the horizontal part of the curves, which indicates cantilever vibration/oscillation/movement where none should be. This noise could easily mask unbinding events of smaller forces—as the individual FDCs show, for example.
To understand the investigated bond’s properties, measurements are repeated several times for various pulling velocities (the speed with which the cantilever is retracted). Consequently, one kspec plot represents only a fraction of a full dataset—Fis, for example, collects eleven velocities (Fis, 2018, pp. 38, 61). The results of all pulling speeds are then grouped to calculate so-called loading rate dependence plots. The specific mathematical model used for this calculation depends on the interaction. For discrete, individual energy barriers (unbinding regimes), the modelled fit appears linear in semilogarithmic graphs (Fis, 2018, pp. 24, 41).
Fis describes two different ways of calculating the model, ultimately choosing the “more accurate” one, though it is not discernible why. In theory, their chosen approach should indeed be more granular, but there is no information on the (potential) influence(s) of the diverging methods. One graph presents the two fit types side by side, but their “error bars are omitted for better readability” and only “two exemplary fits of two different experiments are shown” (Fis, 2018, p. 41). Consequently, no comparison is possible. Why Fis does not showcase a direct comparison, nor mention any experimental condition, is entirely unclear.
Lastly, the entire dataset is narrowed to “the interval [µ ± s] (i.e., first main peak in the force PDF)” to remove statistically insignificant outliers that can result from “some unspecific events” (Fis, 2018, p. 41). However, absolutely no information about any real measurements are given. It remains indiscernible how either fit or trimming influence the data, how many data points are excluded, how strongly the outliers deviate from the mean, and so forth. It is all simply omitted, unmentioned.
Consequently, it is unclear how reliable any of Fis’ findings really are. They only show these ultimately calculated fits—with “[t]he data points of all single unbinding events […] omitted for the sake of clarity” in all cases. Error bars are equally omitted.
Though this minimalistic depiction of results is scientifically dissatisfying, and somewhat precludes scrutiny, several serious problems are obvious. For example, two different results are presented for the same experiment. The SecYEG-SecA interaction (without available ATP) yields two clearly diverging fits (Fis, 2018, p. 50 [Fig. 5.5, black line] vs. p. 52 [Fig. 5.7, right panel, continuous black line]). Nonetheless, somehow both of these linear fits identify the same bond lifetime 𝜏=0.08 s, relating it to each graph once on separate occasions (Fis, 2018, pp. 50, 51, 52). This is… mathematically interesting, to say the least. Of course, once again, it is neither noticed, nor explained.
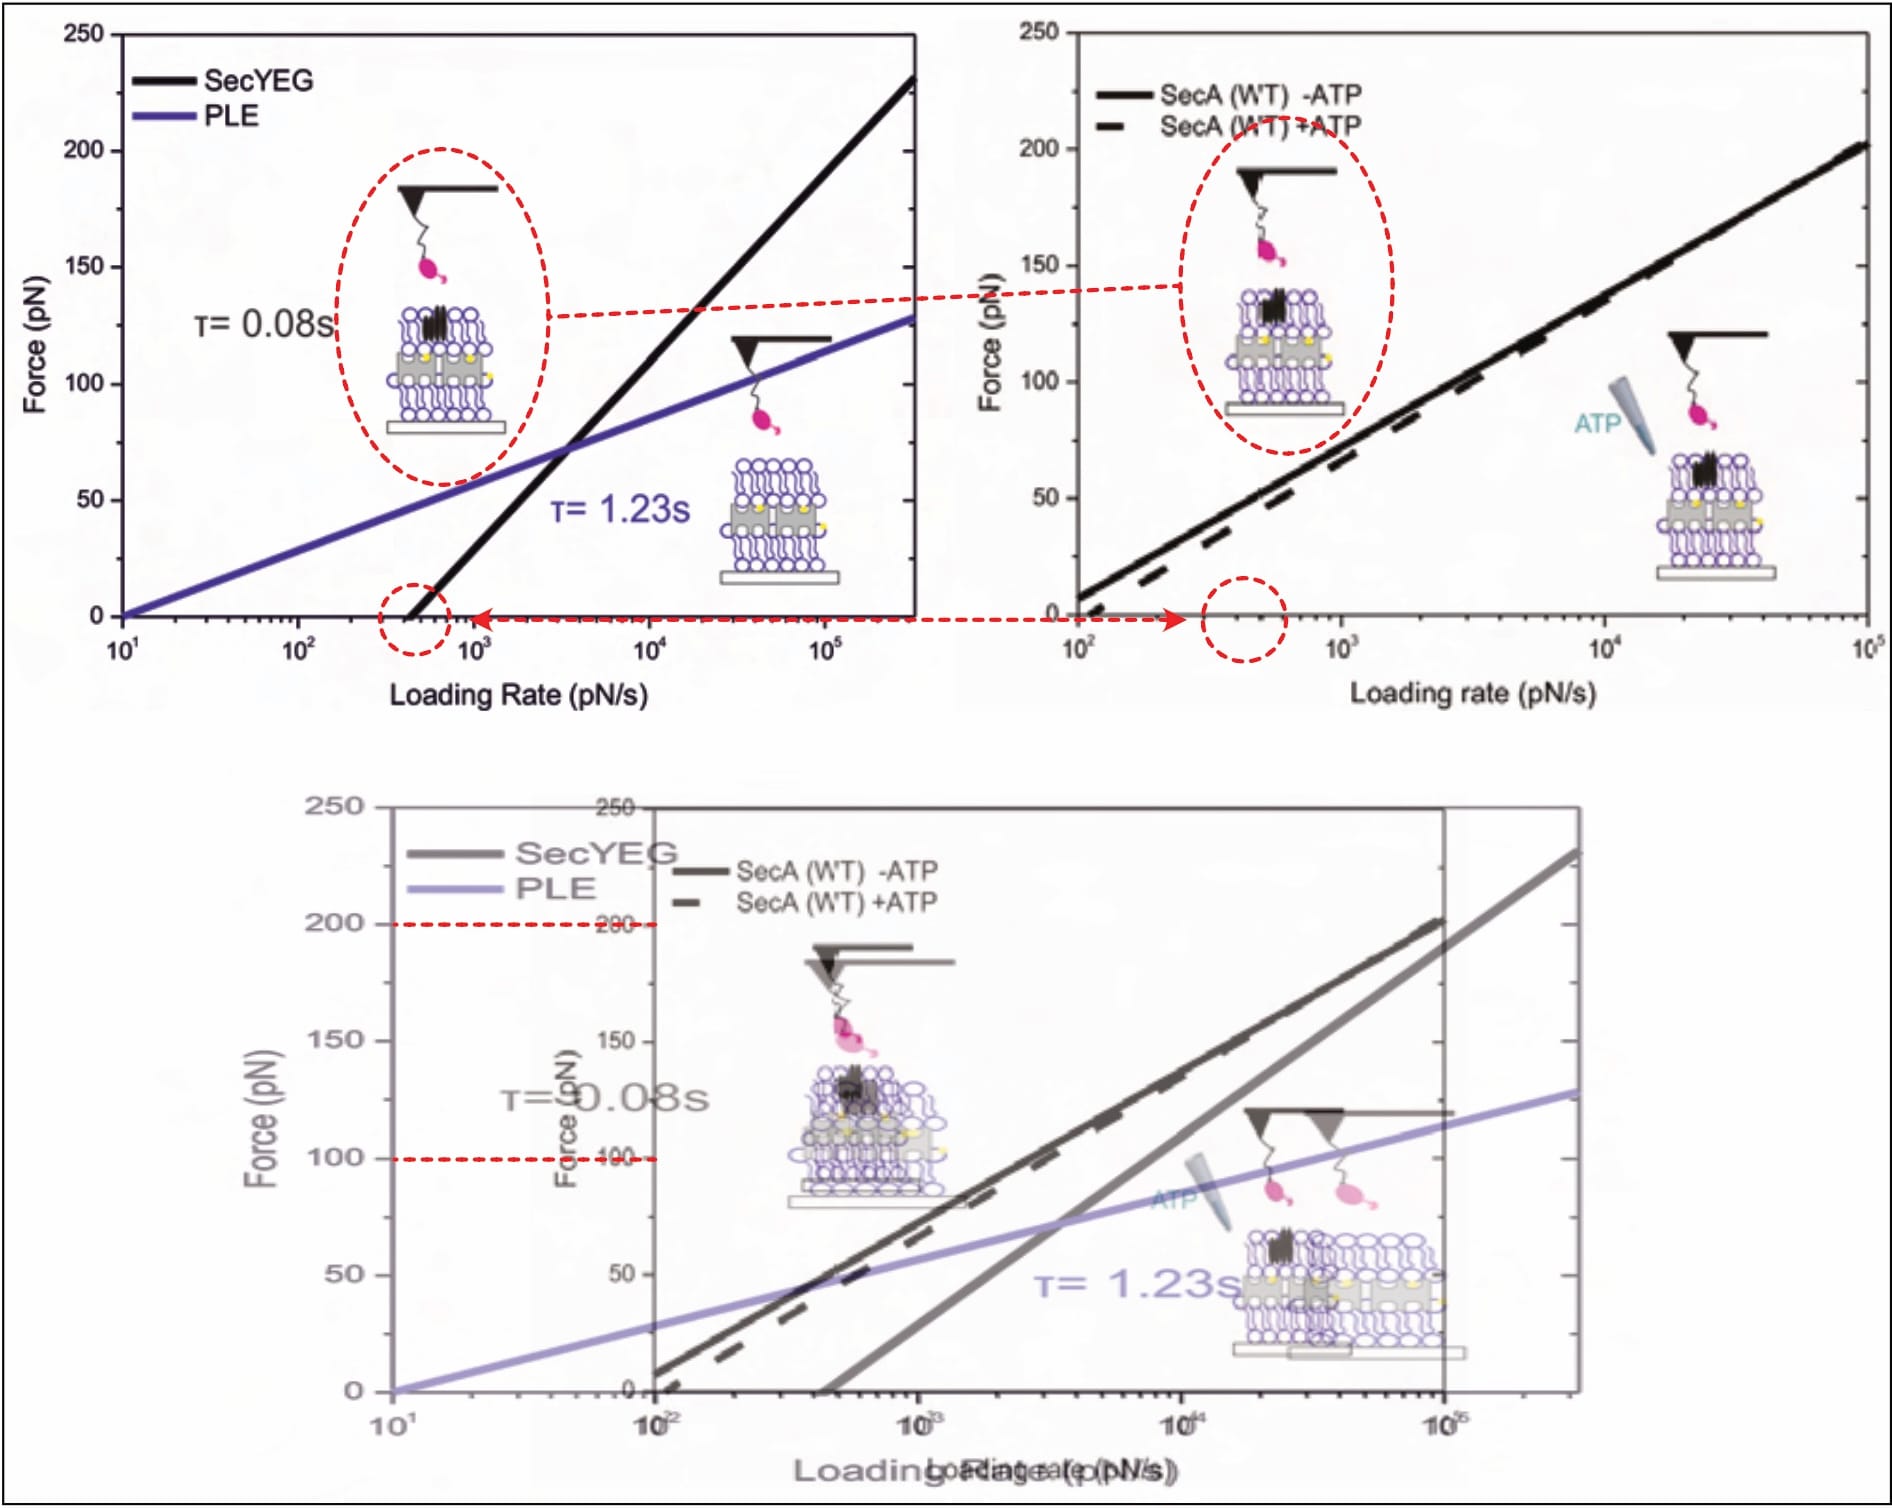
Furthermore, it is interesting that almost all of Fis’ final results suggest negative forces at a loading rate of zero pN/s. The whole investigation is built on the (legitimate) premise that the two constituents spontaneously interact, yet these findings imply they repel one another. Even assuming the interaction only forms after absorbing its surroundings’ residual energy, the implied bond-forming-forces are clearly too high to support the investigation’s pivotal prerequisite. (Note: The X-axis does not start at zero for most graphs in the figure below.)
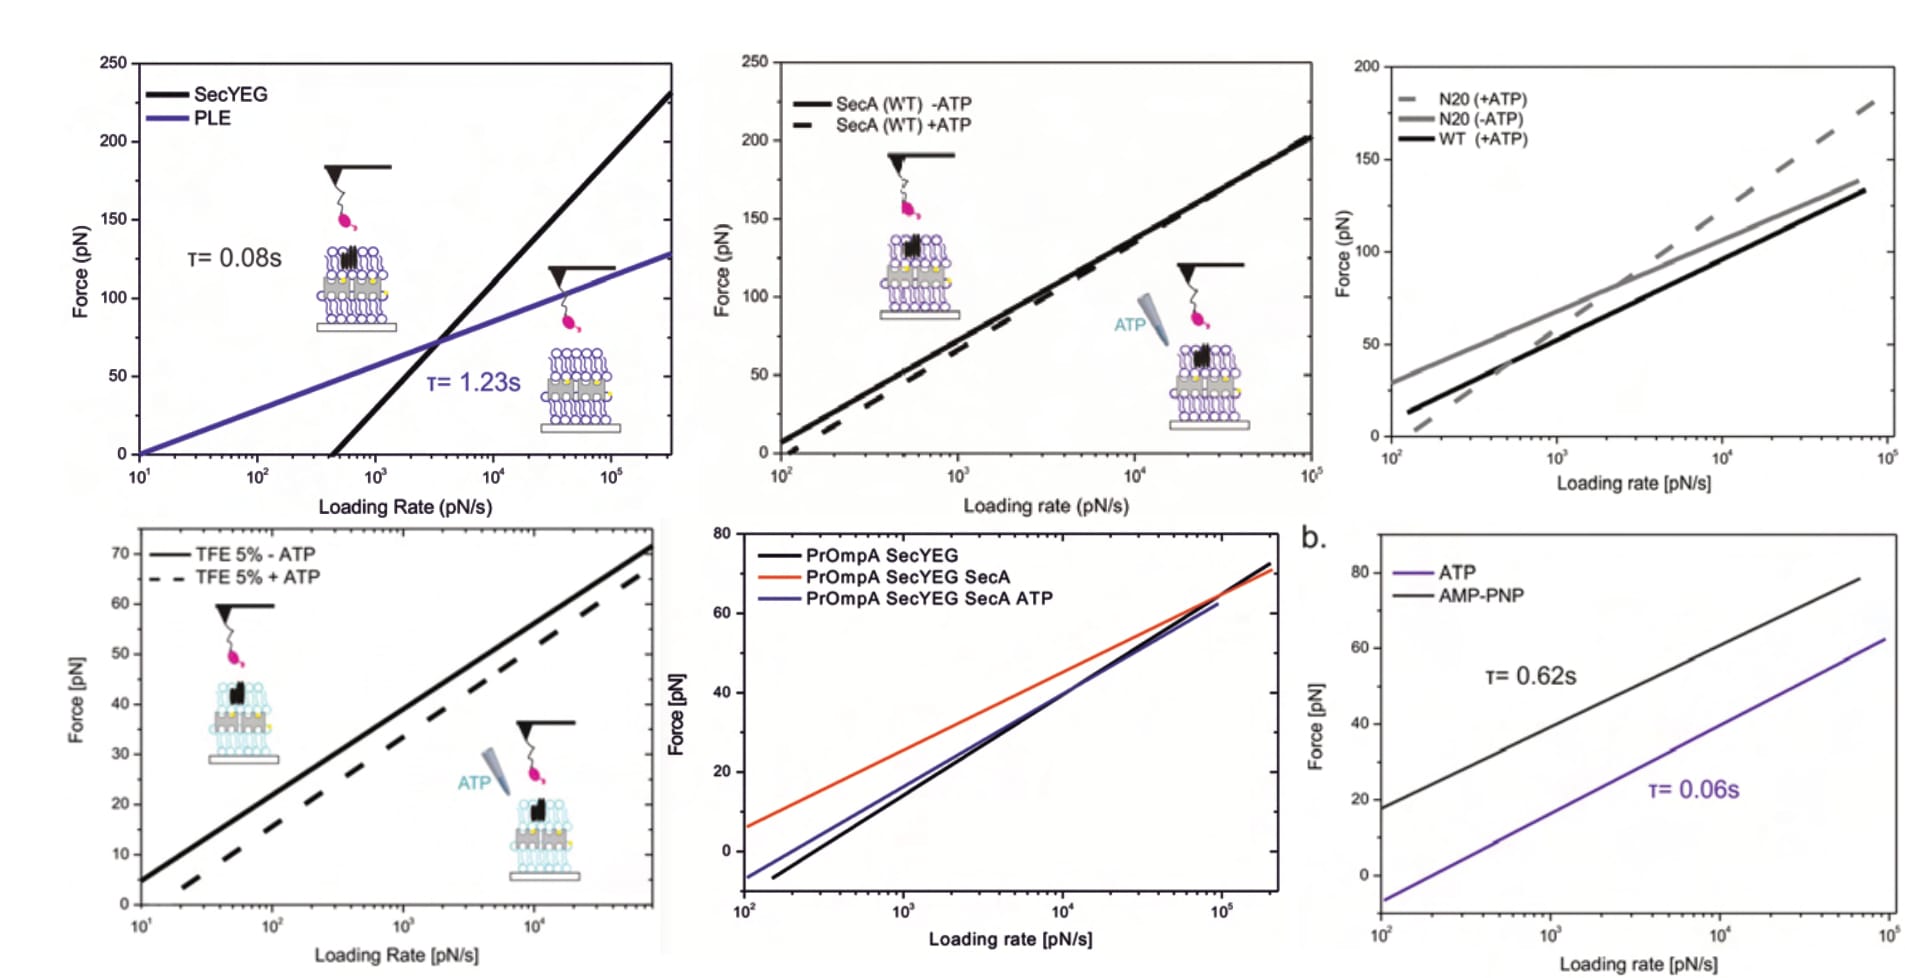
Lastly, the identified unbinding forces appear surprisingly large (especially considering the bond’s biological function), with average maxima between approximately 70 and 230 pN. An earlier publication of the same department (and same primary investigator) finds similar forces (at similar loading rates) for antibody-antigen interactions; highly specific and particularly strong bonds (with a biological function in which such results make sense). Once again, these decidedly surprising findings are not discussed whatsoever.
The graver implication of these forces, however, is that they clearly suggest sample destruction. As already elaborated, Fis investigates a fragile multi-layered surface, the integrity of which is paramount (according to its original developer; see discussion above). The individual layers are anchored by streptavidin-biotin bonds, a well-researched interaction that represents one of the strongest known non-covalent bonds in nature (and is thus often exploited by scientists). In AFM experiments of the same department (!), with overlapping researchers (!!), this bond broke at lower forces than Fis finds—e.g. at 31.3 pN for a loading rate between approximately 800 and 1333.3 pN/s (Köhler et al., 2014, p. 12536; Note: The loading rate can be calculated from the publication-included details.). Another publication of the same department ruptured the avidin-biotin bond at “~40pN at 1.4nN/s loading rate”, in close agreement. Fis finds mostly similar and up to twice that value at the respective loading rates (compare Figure 9 above, around 10³ pN/s). Despite this knowledge being immediately available in the very same lab (supervised by the same primary investigator), the point is not even mentioned, and it remains unclear which interactions were actually observed.
Which brings about an interesting question: How did Fis verify the signal’s origin? This is not a trivial question, since the AFM tracks only a cantilever’s movement. What causes this movement therefore needs concrete deliberation. Any hypothetical source must be verified, or the signal can’t be trusted. A simple way to verify interaction specificity are so-called ‘block experiments’, where “the surface receptors need to be inactivated by injection of a blocking agent into the measurement solution” (Fis, 2018, p. 19). This causes a situation “in which the binding sites are saturated and therefore no recognition signal will be produced” (Fis, 2018, p. 15). In essence, an abundance of interaction partners are provided for the surface-embedded protein, making it dramatically less likely for them to interact with the cantilever-tethered molecule (because they are already busy). In 2009, the primary investigator considered it “mandatory that the specificity of receptor-ligand interaction be demonstrated by blocking experiments” (Hinterdorfer & Van Oijen, 2009, p. 416). Nonetheless, Fis performs none.
In their investigation, the SecA-SecYEG interaction represents only one cooperation of an elaborate cellular machinery. As the thesis progresses, more constituents are added, until finally prOmpA is tethered to the cantilever, SecYEG embedded in the surface, and “the motor-protein SecA and ATP [were] injected” into the measurement chamber (Fis, 2018, p. 58). This directly shows that SecA and ATP could easily have been used for block conditions in the respective investigations. They are simply not performed.
Instead, SecA’s interaction is compared to a mutant variant, for which—supposedly—no interaction is observed. Putting aside the fact that an interaction (of the mutant) is actually visible (in TREC images, as discussed above), this logic is fundamentally flawed: The absence of signal with one cantilever says absolutely nothing about the signal of another. What verifies that the non-interacting cantilever was even properly functionalised in the first place? Nonetheless, the same ‘logic’ is used for prOmpA investigations, which is also compared to a (non-interacting) mutant (Fis, 2018, pp. 15, 19, 59-65).
Summary
In a nutshell, Fis’ thesis collapses entirely. Though they show far too little to properly scrutinise their findings, every little bit that can be viewed is deeply and seriously flawed. Their sample’s complex assembly is never shown, measurements commence at random positions that supposedly represent proteins, the orientation of which is unclear, and neither position nor sample constitution are ever verified. Their signal selection is arbitrary (for both imaging and force spectroscopy), their results are (consistently) self-contradictory, they omit the entire analysis procedure, fail to reflect at every turn, and don’t even control their findings. Results are repeated for different experiments, then diverging results are presented for one and the same condition. It is unclear how much data is trimmed, there are no error bars or data clouds, no sample sizes, no quality-of-fit indicators, nothing. In similar fashion, their supposed findings are not actually discussed, nor their implications—e.g. the many indicators of sample destruction.
And the here voiced criticism is not exhaustive. Fis also omits experimental protocols:
- It is nowhere detailed how they form a “dense layer of SecA molecules on a mica substrate” (Fis, 2018, p. 55).
- The protocol for the production of their used “SecYEG proteoliposomes containing 5% of biotinylated lipids” is nowhere described, as their protocol uses only other lipids (Fis, 2018, pp. 33, 46).
- The reduction of “the amount of biotin-cap-PE was reduced from 5% to 0.01%” for one experiment, but it is again unclear how (Fis, 2018, p. 56).
In similar fashion, the details of their data and the extensive analysis procedure AFM experiments entail, are nowhere presented. According to Fis’ thesis, they collected (Note: The large ranges result from ambiguous protocol descriptions):
- between 171,600 and 772,200 FDCs (force spectroscopy curves),
- 858-3861 TREC recordings (images), and
- 141-643 kspec plots (statistical results of individual pulling velocities).
Of which they show: five TREC recordings, including two duplicates. Thus, there are three images. Everything else are exemplary figures to describe the process of measuring and analysing the data, or ultimately calculated findings—all of which you can see above. (It warrants contemplating how the actual data looks, considering Fis' choice of so obviously flawed figures as exemplary representatives. Presumably, these were part of the cleanest, most formidable options.)
They also omit all information that would allow even just weak estimations regarding result reliability, at times deliberately so ‘to improve legibility’. The thesis lacks:
- effective spring constants,
- cantilever spring constants,
- exact measurement parameters,
- fits of mathematical model for unbinding of linker-tethered molecules,
- selection criteria to identify real unbindings,
- data trimming effects,
- data clouds,
- error bars and all other statistical parameters,
- exact sample sizes,
- identification process of SecYEG orientation in the membrane, and
- all of the above-mentioned data.
Their appendix consists of three SDS-PAGE gels that were produced by a colleague during protein production. That colleague’s thesis will be our next and last stop, which will let us pinpoint the exact moment things went awry—and thus reveal just how ludicrous this decade-long situation is.


